
Understanding the Essentials of Google Analytics 4 Report Format
Elevate your data analysis with powerful reporting strategies. This comprehensive guide unveils best practices for crafting compelling Google Analytics 4 reports. Learn to structure, visualize, and tailor reports for maximum impact. Boost your organization's data-driven success!
Have you ever been presented with a mountain of data, spreadsheets overflowing with numbers, and charts stacked high? Tasked with uncovering valuable insights, but the sheer volume feels paralyzing? Well, this data overload is the reality for many businesses today.
But have you thought if you could transform this data deluge into a powerful decision engine? The key lies in the Google Analytics 4 report format. It’s your secret weapon, a structured framework for organizing and presenting your data analysis clearly, concisely, and impactfully.
This blog post is your guide to unlocking the power of the Google Analytics 4 report format. We’ll explore how a standardized approach can transform raw information into actionable insights.
Let’s dive in!
Key Takeaways
- Learn to convert overwhelming data into a powerful decision engine by mastering effective Google Analytics 4 report formatting techniques.
- Discover the art of presenting insights clearly through structured frameworks and concise language, ensuring maximum stakeholder impact.
- Optimize your Google Analytics 4 reports for mobile viewing, ensuring accessibility and usability across various devices and platforms.
- Implement robust data protection measures, including encryption and access controls, to safeguard sensitive information and maintain confidentiality and integrity.
- Empower stakeholders with actionable insights from Google Analytics 4 reports, driving informed decision-making and organizational success.
Understanding Google Analytics 4 Reports: Your Gateway to Data-Driven Decisions
Google Analytics 4 reports are indispensable assets in the modern business landscape. They are powerful instruments for extracting actionable insights from data and guiding strategic decision-making processes.
Today, where organizations accumulate vast amounts of information from various sources, transforming raw data into meaningful insights is essential for maintaining a competitive edge. DiGGrowth aids in this transformation by offering sophisticated analytics and seamless data integration, enabling businesses to derive precise, actionable insights that drive effective strategies and enhance performance.
The Anatomy of Google Analytics 4 Reports
- Data Collection
- Data Analysis
- Insights & Findings
- Actionable Recommendations
- Decision Empowerment
Introduction to Google Analytics 4 Reports
Google Analytics 4 reports play a pivotal role in this process by offering a structured framework for analyzing data, uncovering trends, and deriving insights that inform organizational strategies. Unlike raw data or simple summaries, Google Analytics 4 reports provide a deeper understanding of complex datasets, enabling stakeholders to make informed decisions based on evidence and analysis rather than intuition or guesswork.
The importance of Google Analytics 4 reports lies in their ability to translate data into actionable insights that drive business growth and innovation. These reports offer a multitude of benefits:
- Uncover Hidden Trends:
- Measure Success:
- Optimize Performance:
- Data-Driven Decisions:
- Improved Communication:
Analyzing data patterns can help you identify trends you might otherwise miss. This allows you to capitalize on opportunities and mitigate potential risks.
Google Analytics 4 reports help you track the effectiveness of your marketing campaigns, website optimization efforts, and overall business strategies.
Data insights reveal areas for improvement. Use these insights to refine your approach and maximize the return on your investments.
Google Analytics 4 reports provide a data-backed foundation for strategic decision-making, leading to more informed and successful strategies.
Reports present data concisely and organizedly, facilitating effective communication between teams and stakeholders.
Types of Google Analytics 4 Reports
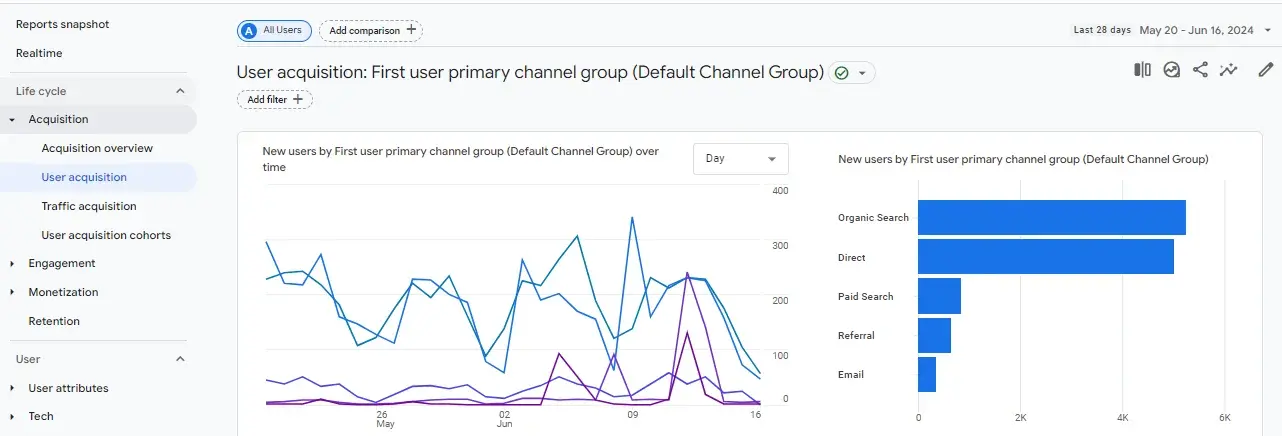
Traffic Analysis Reports
Think of traffic analysis reports as the who, what, and when of your website or app’s visitor landscape. These reports provide in-depth insights into your audience demographics, helping you answer critical questions like:
- Where are your visitors coming from geographically? Are they primarily local, national, or international? Understanding your visitor base allows you to tailor your content and marketing strategies for maximum reach.
- What devices are they using to access your platform? Is your website mobile-friendly? Do most visitors use desktops or laptops? Understanding device usage helps you optimize your user experience for different platforms.
- How many unique visitors do you have? Tracking visitor numbers helps you gauge overall website or app traffic and measure audience growth over time.
By utilizing traffic analysis reports, you gain a clear picture of your audience, enabling you to make informed decisions about content strategy, user experience optimization, and marketing campaign targeting.
User Behavior Analysis Reports
User behavior analysis reports offer insights into how users interact with digital platforms, including actions such as clicks, scrolls, and navigation paths. Organizations can optimize user experience, identify conversion barriers, and enhance engagement and retention rates by analyzing user behavior. They provide invaluable insights into how users interact with your platform, helping you answer questions like:
- What pages are most popular, and which ones have low engagement? Identifying user preferences helps you prioritize high-performing content and revamp low-engagement pages.
- How long do users typically stay on your site? Understanding time spent on your platform indicates user interest and can reveal areas where you might lose their attention.
- What actions do users take (e.g., purchases, sign-ups, form submissions)? Tracking user actions allows you to measure the effectiveness of your call-to-action (CTA) elements and identify areas to optimize for higher conversion rates.
By analyzing user behavior, you better understand how users navigate your platform. This allows you to tailor your offerings to meet their needs better and improve the overall user experience.
Conversion Tracking Reports
![]()
By tracking conversion metrics, organizations can optimize conversion funnels, allocate marketing budgets efficiently, and maximize return on investment (ROI). These reports help you answer critical questions like:
- Are users completing online purchases? Tracking purchase completion rates can help you measure your e-commerce strategy’s effectiveness and identify improvement areas.
- Are users downloading your resources or signing up for your newsletter? Tracking form submissions helps you gauge the effectiveness of your lead-generation efforts and identify what content resonates with your audience.
Conversion tracking reports clearly show how effectively your website or app drives desired actions. By analyzing these reports, you can optimize your marketing campaigns, landing pages, and CTAs to maximize conversions and achieve your business objectives.
Designing the Perfect Format
While the type of Google Analytics 4 report you choose depends on your specific goals, one crucial element remains constant – effective formatting. An impactful report goes beyond just presenting data; it tells a clear story, highlights relevant insights, and ultimately guides users toward actionable decisions.
Clarity in Data Presentation
- Simplify Complex Data:
- Use Clear and Concise Language:
- Provide Context:
Break down complex data into digestible chunks and use visual aids such as charts, graphs, and tables to illustrate key trends and patterns.
Avoid technical jargon and use language that is easily understandable to the intended audience. Clearly define terms and provide explanations where necessary.
Contextualize data by explaining the significance of key metrics and how they relate to business objectives. Help stakeholders understand the implications of the data presented.
Relevance to Business Objectives
The relevance of Google Analytics 4 reports to business objectives is crucial for ensuring that stakeholders can derive actionable insights that drive decision-making. Key considerations for ensuring relevance include:
- Align with Organizational Goals:
- Highlight Key Performance Indicators (KPIs):
- Provide Contextual Insights:
Tailor the content of Google Analytics 4 reports to align with the organization’s overarching goals and priorities. Focus on metrics that directly impact business performance and outcomes.
Identify and prioritize key performance indicators most relevant to the organization’s objectives. Ensure that these KPIs are prominently featured in the report and are linked to business outcomes.
Frame insights within the broader context of the organization’s strategic initiatives and market dynamics. Help stakeholders understand how the data presented in the report relates to the organization’s long-term vision and goals.
Actionable Insights
The ultimate goal of Google Analytics 4 reports is to provide stakeholders with actionable insights that they can use to drive meaningful change and improvement. Key considerations for delivering actionable insights include:
- Focus on Impactful Recommendations:
- Provide Clear Calls to Action:
- Track Progress and Iteration:
Translate insights into concrete recommendations that stakeholders can act upon to achieve desired outcomes. Prioritize recommendations based on their potential to drive measurable results.
Clearly outline the steps stakeholders should take in response to the insights presented in the report. Empower stakeholders with the information they need to make informed decisions and take decisive action.
Monitor the implementation of recommendations and track progress toward achieving desired outcomes. Based on feedback and evolving business needs, iterate on the insights presented in the report.
Tailoring to Audience Needs: Crafting Reports that Resonate
The power of an Google Analytics 4 report lies not just in the data it presents but also in how effectively it communicates that data to its intended audience. A one-size-fits-all approach doesn’t work.
Importance of Audience Analysis
Audience analysis involves gathering insights into the needs, preferences, and expectations of the individuals or groups consuming the Google Analytics 4 reports. By understanding the audience’s perspective, organizations can ensure that their reports resonate effectively and drive desired actions. Here’s why:
- Clarity & Comprehension:
- Focus on Relevance:
- Enhanced Engagement:
Tailoring your audience’s level of detail, technical language, and data visualization choices ensures clear understanding and avoids information overload.
You can prioritize the most relevant data points and insights by understanding your audience’s goals and challenges.
A report that speaks directly to their needs and interests fosters engagement and motivates your audience to take action based on your findings.
Pro Tip: By investing time in audience analysis, you ensure your reports become valuable communication tools that resonate with different user groups within your organization.
Strategies for Tailored Reporting:
Now that we understand the importance of audience analysis let’s explore strategies for tailoring GA4 Google Analytics 4 reports:
Stakeholder-Specific Reports:
Different stakeholders within your organization have different goals. Here’s how to cater to their specific needs:
- Executives:
- Marketing Teams:
- Product Teams:
Focus on high-level summaries, key performance indicators (KPIs), and visualizations that clearly illustrate overall performance and trends.
Provide detailed insights into user acquisition, content performance, and campaign effectiveness with actionable recommendations for optimization.
Offer user behavior analysis highlighting user interaction with specific features, identifying areas for product improvement.
Customized Reporting Templates:
Don’t reinvent the wheel every time. Here’s how to leverage templates for efficiency:
- Develop Templates for Common Report Types:
- Customize Templates for Specific Needs:
- Save Time & Maintain Consistency:
Create pre-formatted report templates for traffic analysis, user behavior analysis, and conversion tracking.
Within each template, allow for customization of data points and visualizations based on the specific audience and goals.
Templates save time and ensure a consistent report format across your organization.
Interactive Dashboards:
Go beyond static reports and explore the power of interactive dashboards:
- Real-time Data Exploration:
- Increased Accessibility:
- Enhanced User Experience:
Interactive dashboards allow users to drill down into specific data points and explore trends dynamically.
Dashboards can be shared and accessed by multiple users across the organization, fostering collaboration and data-driven decision-making.
Interactive elements and visualizations engage data exploration and promote user buy-in to your insights.
Best Practices and Tips: Ensuring Accuracy and Consistency in Your Reports
Consistency and accuracy are essential to Google Analytics 4 report formatting, ensuring stakeholders can rely on the information presented to make informed decisions. DiGGrowth’s advanced data harmonization and analysis tools help maintain these standards by ensuring data integrity and uniformity throughout the report. By leveraging DiGGrowth, businesses can confidently present findings that stakeholders can trust, facilitating better-informed decision-making and strategic planning.
Standardized Reporting Templates
Standardized reporting templates are a foundation for maintaining consistency in Google Analytics 4 report formatting. Key best practices for implementing standardized reporting templates include:
- Establish Formatting Guidelines:
- Create Template Libraries:
- Train Users on Template Usage:
Define formatting for headers, fonts, colors, and data visualization styles. Ensure that all reports adhere to these guidelines consistently to maintain a professional appearance and enhance readability.
Develop a library of standardized reporting templates for different reports, such as traffic analysis, user behavior analysis, and conversion tracking. Provide users access to these templates to streamline the report creation process and maintain consistency across reports.
Conduct training sessions to educate users on using standardized reporting templates effectively—guide them on selecting the appropriate template for their needs and customizing it to meet specific requirements.
Data Validation and Verification
Data validation and verification processes are essential for ensuring the accuracy and reliability of Google Analytics 4 reports. Key best practices for data validation and verification include:
- Implement Data Quality Checks:
- Verify Data Sources:
- Document Data Transformation Processes:
Develop automated data quality checks to identify discrepancies, inconsistencies, or errors in the data. Implement validation rules and alerts to flag anomalies and ensure data integrity throughout the reporting process.
Verify the accuracy and reliability of data sources before incorporating them into Google Analytics 4 reports. Conduct audits and assessments to ensure data sources meet established quality standards and provide accurate and relevant information.
Document data transformation processes, including data cleaning, aggregation, and manipulation, to ensure transparency and reproducibility. Maintain detailed documentation of data sources, transformations, and calculations to facilitate data validation and verification.
Version Control
Version control mechanisms help organizations manage changes to Google Analytics 4 reports and ensure that stakeholders have access to the most up-to-date information. Key best practices for version control include:
- Implement Versioning Protocols:
- Track Revisions and Comments:
- Facilitate Collaboration:
Establish versioning protocols to systematically track changes to Google Analytics 4 reports. Assign version numbers or timestamps to reports to indicate the sequence of revisions and updates.
Maintain a revision history that records changes made to Google Analytics 4 reports, including the nature of the changes and the individuals responsible. Encourage users to provide comments or annotations to document the rationale behind revisions.
Implement collaboration tools and workflows that enable multiple stakeholders to contribute to developing and reviewing Google Analytics 4 reports. Ensure that stakeholders can collaborate effectively while adhering to version control protocols.
Leveraging Technology: Supercharge Your Reporting Workflow with Powerful Tools
Technology empowers organizations to revolutionize their approach to Google Analytics 4 report formatting, enabling them to create more impactful and actionable reports that drive business success. By embracing technological solutions, organizations can streamline processes, enhance visualization, and automate repetitive tasks, ultimately improving the efficiency and effectiveness of their Google Analytics 4 reporting efforts.
DiGGrowth Marketing Brilliance
Effortlessly track your leads’ journey from start to conversion. DiGGrowth utilizes advanced algorithms to analyze data and accurately attribute credit to each marketing touchpoint, giving you clear insights into what’s driving your success. Optimize your marketing mix like a pro. DiGGrowth uses sophisticated data analysis techniques to determine the most effective distribution of your budget across various channels, ensuring you get the best ROI for every advertising dollar.
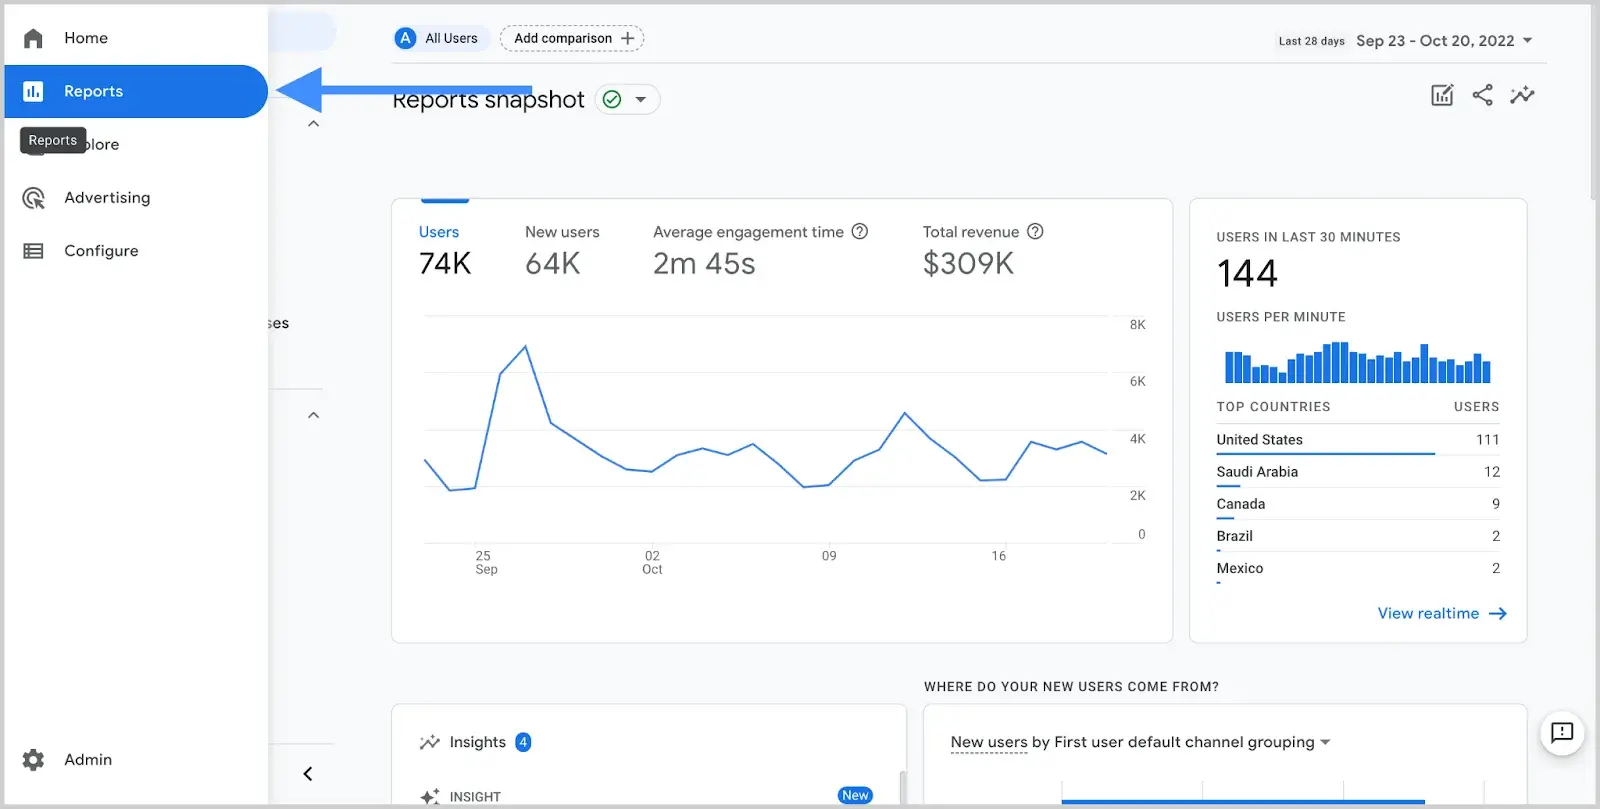
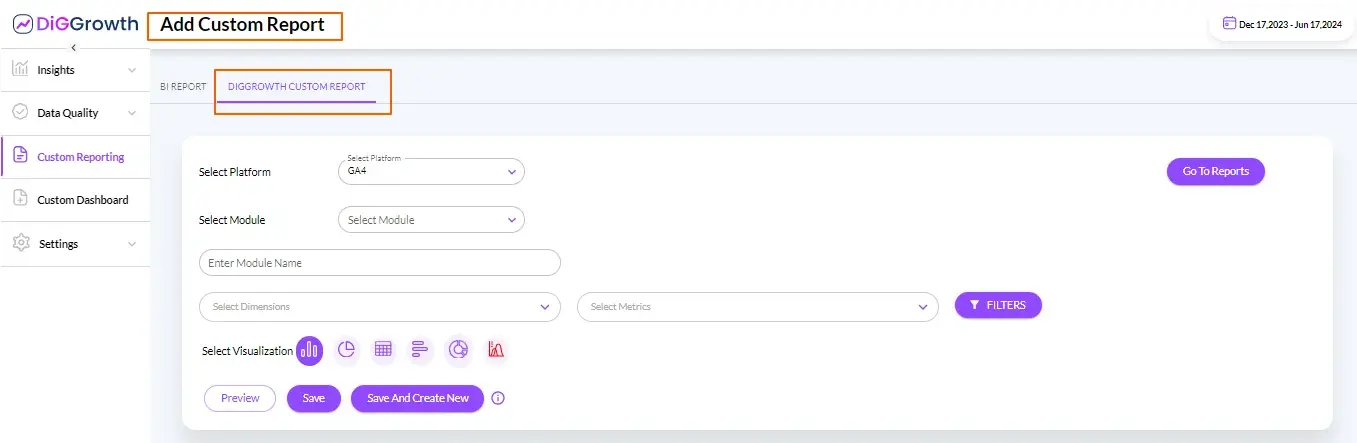
GA4 Report Builder
The GA4 Report Builder, a feature-rich tool provided by Google Analytics, empowers users to craft customized reports tailored to their specific Google Analytics 4 needs. With the GA4 Report Builder, users can select specific metrics, dimensions, and filters to focus on, customizing reports to align with their unique requirements. This level of customization saves time and effort. Thanks to pre-built templates and customization options, it ensures consistency across multiple reports. Moreover, integrated directly with Google Analytics, the GA4 Report Builder seamlessly accesses and analyzes data from GA4 properties, streamlining the reporting process and enabling stakeholders to access timely insights.
Data Visualization Software
Data visualization software transforms complex datasets into compelling visualizations that stakeholders can comprehend and act upon. By leveraging data visualization software, organizations can enhance understanding through visual representations such as charts, graphs, and dashboards. These visualizations not only make data more accessible but also offer interactive features that allow users to explore data dynamically, drill down into details, and uncover hidden insights effortlessly. Additionally, customization options enable users to align visualizations with branding guidelines and reporting requirements, ensuring that insights are visually engaging and impactful.
Automated Reporting Solutions
Automated reporting solutions revolutionize how organizations generate, distribute, and consume Google Analytics 4 reports. By automating manual tasks such as data collection, formatting, and distribution, these solutions save valuable time and resources, enabling organizations to focus on value-added activities. Moreover, by applying predefined templates and guidelines, automated reporting solutions ensure consistency in report formatting and content, reducing the risk of errors and discrepancies. Scalable and adaptable, these solutions can handle large volumes of data and generate reports at scale, making them suitable for organizations with diverse reporting needs and growing data sets.
Challenges: Common Roadblocks and Effective Solutions
Data Quality and Consistency
Ensuring data quality and consistency is pivotal in Google Analytics 4 report formatting. More accurate and consistent data can be needed to maintain the credibility and reliability of reports, leading to misguided decision-making. To address this challenge:
- Implement Robust Data Validation Processes:
- Establish Clear Data Governance Policies:
- Regularly Update Data Sources:
Develop stringent data validation procedures to identify and rectify errors, inconsistencies, and discrepancies before formatting reports.
Implement clear policies and procedures to maintain data quality, integrity, and consistency across all reporting efforts.
Keep data sources up-to-date to ensure that reports are based on the most current and relevant information.
Complexity of Data Visualization
Complexity in data visualization can hinder the effective communication of insights. Presenting complex data clearly and understandably is essential. To address this challenge:
- Simplify Visualizations:
- Leverage Interactive Features:
- Provide Contextual Explanations:
Focus on presenting key insights and information while avoiding unnecessary complexity or clutter in visualizations.
Utilize interactive features in data visualization tools to empower stakeholders to explore data dynamically and customize visualizations as needed.
Accompany visualizations with contextual explanations and interpretations to help stakeholders grasp the significance of the data presented.
Stakeholder Engagement and Communication
Engaging stakeholders and communicating insights effectively are critical for Google Analytics 4 report formatting. To address this challenge:
- Tailor Communication to Audience:
- Offer Training and Support:
- Foster Two-Way Communication:
Customize communication strategies to suit the preferences and needs of different stakeholders, ensuring that insights are presented in a format that resonates with each audience.
Provide training and support to stakeholders to enhance their data literacy and enable them to understand and interpret Google Analytics 4 reports effectively.
Encourage stakeholders to provide feedback and ask questions about the insights presented in reports, fostering a culture of dialogue and continuous improvement.
Time and Resource Constraints
Managing time and resources efficiently is essential in Google Analytics 4 report formatting, especially for organizations with limited bandwidth. To address this challenge:
- Prioritize Reporting Efforts:
- Automate Repetitive Tasks:
- Encourage Cross-Departmental Collaboration:
Identify key priorities and allocate resources to formatting reports that impact decision-making and business outcomes most.
Utilize automation tools to streamline repetitive tasks such as data collection, formatting, and distribution, freeing time for strategic activities.
Foster collaboration across departments to leverage resources and expertise effectively, ensuring that reporting efforts are coordinated and aligned with organizational goals.
Conclusion
Effective Google Analytics 4 report formatting is crucial for informed decision-making and organizational success. By understanding stakeholder needs, leveraging technology, and embracing continuous improvement, organizations can enhance the clarity and relevance of their reports.
Looking ahead, the future of Google Analytics 4 report formatting holds promising opportunities. Data visualization and automation advancements will enable organizations to derive actionable insights more efficiently. By remaining agile and responsive to emerging trends, organizations can drive innovation and maintain a competitive edge in their industries.
Let us prioritize ongoing learning and improvement, ensuring that Google Analytics 4 reporting continues to serve as a valuable asset in driving business growth and achieving strategic objectives.
For further inquiries or assistance, feel free to contact us at info@diggrowth.com .
Ready to get started?
Increase your marketing ROI by 30% with custom dashboards & reports that present a clear picture of marketing effectiveness
Start Free Trial
Experience Premium Marketing Analytics At Budget-Friendly Pricing.

Learn how you can accurately measure return on marketing investment.

How Predictive AI Will Transform Paid Media Strategy in 2026
Paid media isn’t a channel game anymore, it’s...
Read full post post
Don’t Let AI Break Your Brand: What Every CMO Should Know
AI isn’t just another marketing tool. It’s changing...
Read full post post
From Demos to Deployment: Why MCP Is the Foundation of Agentic AI
A quiet revolution is unfolding in AI. And...
Read full post postFAQ's
Google Analytics 4 report formatting is crucial because it presents complex data clearly and understandably, enabling stakeholders to make informed decisions based on insights derived from the data.
Common challenges include: Ensuring data quality and consistency. Simplifying complex data visualization. Effectively engaging stakeholders. Managing time and resource constraints. Keeping up with industry trends.
You can improve Google Analytics 4 report formatting by soliciting stakeholder feedback to understand their needs, testing different report formats to find what works best, staying updated on industry trends, and continuously seeking ways to enhance your reporting practices.
Implement robust data protection measures, such as encryption, access controls, and regular security audits, to safeguard sensitive data.
Use clear visualizations like charts and graphs, provide contextual explanations, and highlight key findings to present statistical data effectively.
Employ responsive design, prioritize essential information, and test reports on different mobile devices and browsers for compatibility.