What A Facebook Ads Report Should Include For Better Campaign Decisions
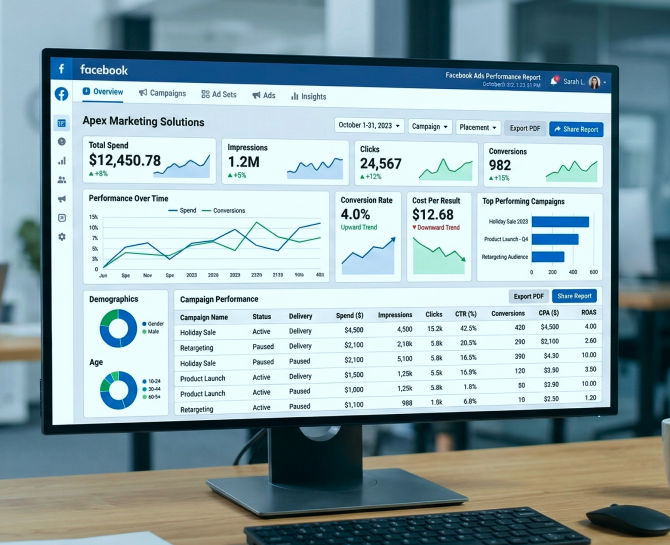
A Facebook Ads report helps organizations measure how advertising campaigns perform and whether marketing investments generate meaningful results. For senior leaders, these reports are important because they translate campaign activity into business impact, helping evaluate return on advertising spend. Read on.
Running Facebook ads often feels productive. Campaigns are active. Budgets are being spent. Clicks and impressions keep increasing.
But here is the uncomfortable question many marketers avoid.
Are those numbers actually helping you make better decisions?
A campaign can generate thousands of impressions and still fail to produce meaningful results. In many cases, the problem is not the ads themselves. The problem is the way performance is reviewed.
Too often, reports become long spreadsheets filled with metrics that look impressive but say very little. Stakeholders see numbers, but they do not see direction. Teams review data, yet struggle to answer simple questions.
What worked. What did not. What should change next.
A well-prepared Facebook Ads report solves this problem. It turns raw campaign data into clear signals that guide strategy, budget allocation, and creative improvements.
Without that clarity, campaigns keep running. Money keeps going out. And decisions rely more on assumptions than evidence.
If you have ever looked at a Facebook Ads dashboard and wondered which numbers actually matter, you are not alone.
Let us dive in.
Key Takeaways
- A well-structured Facebook Ads report helps marketers move beyond surface-level metrics and make clearer campaign decisions based on performance data.
- Audience insights such as age, gender, location, and device performance reveal who actually responds to your ads.
- Creative performance analysis helps identify which visuals, formats, and messaging attract engagement and drive conversions.
- Budget and spend analysis connects campaign costs with outcomes, making it easier to allocate resources effectively.
- Conversion and revenue tracking ensure that reporting focuses on meaningful business results rather than just clicks or impressions.
Start With A Clear Campaign Overview
A Facebook Ads report should begin with a campaign overview that summarizes performance during the reporting period . This section provides a quick reference point for stakeholders before they review detailed campaign metrics.
Instead of presenting scattered data, the overview brings the most important performance indicators together in one place. It allows marketing teams, managers, and clients to quickly understand whether the campaign is meeting its primary objective.
A well-structured overview usually includes the following elements:
- Reporting Period: The specific timeframe the report covers.
- Campaign Objective: The main goal such as lead generation, website traffic, or conversions.
- Total Ad Spend: The total budget used during the campaign.
- Total Results: The number of leads, purchases, or conversions generated.
- Cost Per Result: The average amount spent to achieve each desired action.
- Return On Ad Spend (ROAS): The revenue generated compared to the amount spent on ads.
Presenting this information in a simple format improves readability and helps decision makers review performance quickly.
| Metric | Example |
|---|---|
| Reporting Period | May 1 – May 31 |
| Campaign Objective | Lead Generation |
| Total Spend | $4,500 |
| Leads Generated | 320 |
| Cost Per Lead | $14.06 |
| ROAS | 3.2x |
Pro Tip : Including this overview at the beginning of the report provides important context for the rest of the analysis. Once readers understand the campaign objective and overall results, they can better interpret insights related to audience performance, ad creatives, and placements.
Key Performance Metrics That Help Evaluate Facebook Ad Results
After reviewing the campaign overview, the report should move into performance metrics that explain how the ads actually behaved in the auction and how users responded to them. These metrics help marketers identify patterns in visibility, engagement, and conversions.
Looking at a single number rarely explains campaign performance. A useful report connects several metrics so teams can understand what is happening at each stage of the user journey.
To make this easier to interpret, performance metrics can be grouped into a few practical categories.
Ad Delivery Metrics
Ad delivery metrics show how often ads are being served and how broadly they are reaching the intended audience.
Important delivery indicators include:
- Impressions: The total number of times an ad appeared across placements such as feeds, stories, or reels.
- Reach: The number of individual users who were exposed to the ad at least once.
- Frequency: The average number of times a single user saw the ad.
These numbers help identify delivery patterns. For example, if frequency rises too quickly, the same audience may be seeing the ad repeatedly, which can lead to ad fatigue and declining engagement.
Interaction Metrics
Once ads are delivered, the next question is how people interact with them. Interaction metrics reveal whether the creative and message motivate users to take the next step.
Key interaction metrics include:
- Click-Through Rate (CTR): The percentage of impressions that resulted in a click.
- Link Clicks: The number of users who clicked the link that leads to the landing page.
- Engagement Actions: Reactions, comments, and shares that indicate user interest.
Higher interaction levels often suggest that the creative is relevant to the audience. If engagement remains low despite high impressions, it may indicate that the ad message needs refinement.
Traffic Quality Metrics
Clicks alone do not guarantee meaningful engagement. Traffic quality metrics help determine whether users continue interacting with the website after leaving Facebook.
Common indicators include:
- Landing Page Views: The number of users who successfully loaded the destination page after clicking.
- Bounce Indicators: Situations where users click but leave the page almost immediately.
If there is a large gap between clicks and landing page views, slow page loading or tracking issues may be affecting performance.
Outcome Metrics
The final group of metrics focuses on the actions that directly support business goals.
These often include:
- Leads Generated
- Add to Cart Events
- Purchases or Sign-Ups
- Cost Per Acquisition (CPA)
These metrics reveal whether the campaign is producing measurable outcomes rather than simply generating visibility or traffic.
Audience Performance Insights
A Facebook Ads report should not only show how ads perform. It should also reveal who they perform best for. Without audience insights, campaign decisions often rely on assumptions instead of data.
When reports break down performance by audience segments, marketers can quickly see which groups are driving results and which ones are not responding.
Below are the key audience insights that should be included in a Facebook Ads report.
Age Group Performance
Age data shows which age groups interact with the ads and convert.
For example, a report may show that users between 25–34 generate most conversions, while younger audiences click but rarely complete the action. This helps marketers focus campaigns on the age groups that deliver real value.
It also guides creative decisions, since messaging can be tailored to the audience that responds the most.
Gender Performance
Gender insights help determine whether ads resonate more with male or female audiences.
A Facebook Ads report should highlight how engagement, clicks, and conversions differ between genders. In some campaigns, one group may show significantly stronger performance.
When this happens, marketers can refine targeting or develop creatives that better connect with that specific audience.
Location Performance
Geographic performance reveals where ads generate the strongest response.
Reports should break down results by country, region, or city depending on the campaign reach. Some locations often deliver better conversion rates or lower acquisition costs than others.
With this information, advertisers can increase budget in high-performing regions and reduce spending in areas that produce weaker results.
Device Performance
Device data shows how users interact with ads across mobile, desktop, and tablet devices.
In many campaigns, mobile generates the most traffic but desktop may produce higher conversion rates. When this difference appears in a report, it often signals the need to optimize the landing experience or adjust device targeting.
Budget And Spend Analysis
A Facebook Ads report should clearly show how the campaign budget is being used. Without this visibility, it becomes difficult to understand whether spending is producing meaningful results.
Budget analysis helps marketers connect spend with performance . It highlights where money is being used effectively and where it may be wasted.
Spend By Campaign And Ad Set
Most Facebook campaigns are structured with multiple ad sets. Each one targets a different audience or uses different creatives.
A report should show how much budget is spent across these levels.
| Campaign | Ad Set | Spend | Conversions |
|---|---|---|---|
| Campaign A | Audience 1 | $1,200 | 68 |
| Campaign A | Audience 2 | $800 | 24 |
| Campaign B | Audience 3 | $900 | 31 |
This breakdown helps marketers quickly identify which ad sets are delivering stronger results for the budget spent.
Cost Efficiency Over Time
Spend alone does not reveal much unless it is connected to results. A good Facebook Ads report compares spending with metrics such as:
- Cost per click
- Cost per conversion
- Return on ad spend
Tracking these metrics over time helps teams spot performance changes. For example, rising costs may indicate increased competition or creative fatigue.
Budget Allocation Insights
When spending and performance are analyzed together, patterns become clear.
Some campaigns consistently generate better returns with smaller budgets, while others require adjustments to improve efficiency. A Facebook Ads report should make these patterns easy to see.
This allows marketers to shift budget toward campaigns and ad sets that produce stronger results while reducing spend on underperforming ones.
Conversion And Revenue Tracking
A Facebook Ads report should clearly show what happens after users interact with an ad. Metrics like impressions or clicks show interest, but they do not always indicate real results.
Conversion tracking helps connect advertising efforts with meaningful actions taken by users.
Tracking Key Conversion Actions
Every campaign is built around a specific goal. Because of this, a Facebook Ads report should highlight the actions that matter most for that objective.
These actions may include:
- Lead form submissions
- Purchases
- Newsletter signups
- App installs
Tracking these actions helps marketers understand whether the campaign is actually generating valuable outcomes instead of just engagement.
Monitoring Revenue Impact
For sales-focused campaigns, the report should also connect conversions with revenue.
This allows marketers to see how much value is generated from the ad spend. When revenue data is visible, it becomes easier to evaluate whether the campaign is profitable or if adjustments are needed.
Identifying Conversion Gaps
Conversion data can also reveal problems in the customer journey.
For example, a campaign may generate many clicks but very few conversions. This usually indicates issues outside the ad itself, such as a confusing landing page or a weak offer.
When these insights appear in a Facebook Ads report, marketers can focus on improving the user experience rather than simply increasing the budget.
Trend And Time-Based Performance
A Facebook Ads report should also show how campaign performance changes over time. Looking at metrics from a single day or week rarely gives the full picture.
Time-based reporting helps marketers understand patterns. It reveals when campaigns perform best and when performance starts to decline.
Daily And Weekly Performance Trends
Campaign data should be reviewed across different time periods, such as daily or weekly performance.
This makes it easier to spot trends like sudden drops in conversions, rising costs, or spikes in engagement. These patterns often signal when campaigns need attention.
For example, a steady increase in cost per conversion over several days may indicate creative fatigue or audience saturation.
Identifying Performance Peaks
Time-based reports can also highlight the periods when campaigns perform the strongest.
Some campaigns generate higher engagement during specific days of the week or times of the month. Recognizing these patterns allows marketers to schedule campaigns more strategically.
Supporting Smarter Optimization
When trends are visible, decisions become easier. Instead of reacting to isolated data points, marketers can adjust campaigns based on consistent patterns.
Over time, this approach leads to better optimization and more stable campaign performance.
Why A Structured Facebook Ads Report Matters
Running Facebook Ads without a clear reporting structure often leads to scattered insights. Numbers exist, but they do not always translate into clear decisions.
A well-organized Facebook Ads report brings everything together. It highlights performance metrics, audience insights, creative effectiveness, budget usage, and conversions in one place. This makes it easier to understand what is actually driving results.
When marketers review these insights regularly, campaign decisions become more strategic. Budgets can be shifted toward stronger audiences, creatives can be optimized based on real engagement data, and underperforming campaigns can be improved or paused.
Over time, this approach turns reporting from a routine task into a powerful tool for improving campaign performance.
Conclusion
A Facebook Ads report should do more than organize campaign numbers. It should reveal patterns, highlight opportunities, and make optimization decisions easier for marketers.
When the right insights are included, reports start answering the questions that actually matter. Which audiences respond the most. Which creatives capture attention. Where the budget generates real value. This clarity allows teams to move from guessing to improving campaigns with confidence.
At DiGGrowth, the focus is always on turning marketing data into actionable insight. A structured Facebook Ads report is one of the most effective ways to understand performance and unlock better campaign decisions.
If you want to turn your campaign data into meaningful growth insights, the conversation can start today. Reach out to the DiGGrowth team and explore how smarter reporting can reshape your advertising strategy.
Write to us at info@diggrowth.com and let the data tell a better story for your campaigns.
Ready to get started?
Increase your marketing ROI by 30% with custom dashboards & reports that present a clear picture of marketing effectiveness
Start Free Trial
Experience Premium Marketing Analytics At Budget-Friendly Pricing.

Learn how you can accurately measure return on marketing investment.

How Predictive AI Will Transform Paid Media Strategy in 2026
Paid media isn’t a channel game anymore, it’s a chessboard. Search, social, programmatic, video, influencer, native,...
Read full post post
Don’t Let AI Break Your Brand: What Every CMO Should Know
AI isn’t just another marketing tool. It’s changing how we connect with customers, personalize content, and...
Read full post post
From Demos to Deployment: Why MCP Is the Foundation of Agentic AI
A quiet revolution is unfolding in AI. And it’s not happening inside research labs. For decades,...
Read full post postFAQ's
The main purpose is to help decision-makers understand whether ad spend is delivering measurable results. A clear report connects campaign performance with outcomes such as leads, sales, or revenue impact, allowing leaders to evaluate marketing effectiveness quickly.
Executive reports should focus on performance insights rather than too many platform metrics. They should highlight trends, cost efficiency, audience response, and conversions so leadership teams can make strategic decisions without reviewing excessive operational data.
Reports reveal which campaigns, audiences, or creatives deliver the best results for the budget spent. With this visibility, leaders can allocate more budget to high-performing segments and reduce spending on campaigns that do not generate meaningful outcomes.
Rising costs, declining engagement, or strong traffic with weak conversions are common signals that a campaign needs attention. These patterns often point to issues with targeting, creative messaging, or the landing experience.
A standardized reporting structure ensures that performance insights remain consistent across campaigns and time periods. This consistency helps marketing leaders evaluate progress, compare results, and make more confident decisions about future advertising investments.