
6 AI Report Generation Tools That Are Redefining Business Intelligence
Decision speed depends on how quickly data becomes usable context for action. AI report generation tools are changing how teams handle reporting, shifting it from manual dashboards to structured insights. This article breaks down leading tools, their use cases, and real business applications across industries.
Most teams are not struggling with data anymore. They are struggling with everything that comes after it. Too many dashboards. Too many exports. Too many versions of the truth sitting in different tools.
And yet, decisions still need to be made quickly.
Reports take hours to build, but only minutes to become outdated. By the time insights reach decision-makers, the context has already shifted. The result is familiar. Reactive decisions. Missed patterns. And a constant sense that the data exists, but is not really working for you.
AI report generation changes this rhythm completely.
Instead of asking teams to build reports manually, AI systems now assemble, structure, and interpret data automatically. Not just faster reporting, but smarter reporting that highlights what actually matters.
Think about it this way. A marketing team no longer needs to pull separate reports for ads, website traffic, and CRM performance. AI can combine it all and surface what changed, why it changed, and what needs attention.
That shift is subtle, but powerful.
It moves reporting from something you prepare for meetings to something that actively guides decisions.
And that is exactly why AI report generation tools are becoming central to modern business intelligence.
Key Takeaways
- Teams are no longer just consuming dashboards. They interact with data in real time through search, automation, and AI-driven insights.
- The real value is not in generating more reports, but in removing delays between data collection and decision-making.
- Different tools solve different layers of the problem, from marketing attribution to enterprise governance and self-serve analytics.
| Tool | Core Strength | Best Use Case | Key AI Capability |
|---|---|---|---|
| DiGGrowth | Revenue-focused marketing intelligence | B2B teams needing ROI clarity | AI-driven attribution and unified marketing reporting |
| Microsoft Power BI | Enterprise-grade reporting and scalability | Large organizations with complex data systems | Natural language queries and AI-powered insights |
| Tableau | Strong data visualization and storytelling | Teams working with large visual datasets | AI-assisted trend detection and visual insights |
| Zoho Analytics | Affordable automated reporting | SMBs and growing businesses | AI-generated reports and scheduling automation |
| ThoughtSpot | Search-based, self-serve analytics | Fast decision-making for business users | Natural language search for instant insights |
| Google Cloud Looker | Data consistency and governance | Enterprises needing unified reporting logic | AI insights built on structured data models |
1. DiGGrowth: AI Reporting Built for Marketing and Revenue Clarity
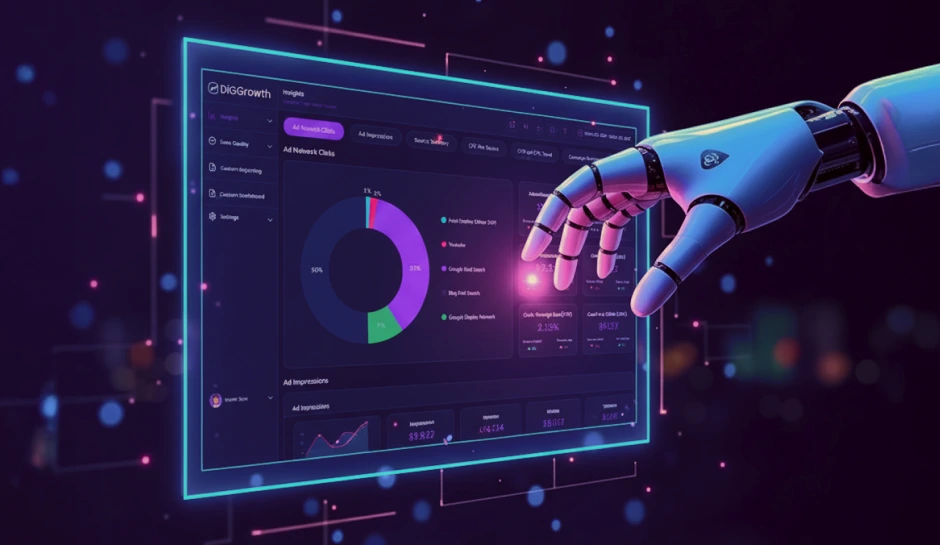
DiGGrowth sits in a slightly different space compared to traditional BI tools. Instead, it focuses on one of the biggest reporting gaps in modern businesses: connecting marketing activity to actual revenue outcomes.
Most teams can see their clicks, impressions, and leads. What they struggle with is understanding what those numbers mean together. That is where DiGGrowth becomes useful.
It brings fragmented marketing data into a single reporting layer and uses AI to structure it into performance insights that are easier to act on.
What Makes It Stand Out
DiGGrowth is built around clarity rather than complexity.
- It connects multiple marketing channels into one reporting system.
- It reduces the need for manual dashboard building.
- It highlights performance shifts instead of just showing raw metrics.
- It focuses heavily on attribution and ROI visibility.
Where It Fits Best
This tool is especially relevant for B2B marketing teams that deal with long buying cycles and multiple touchpoints.
For example, a SaaS company running paid ads, SEO campaigns, and email nurturing can use DiGGrowth to understand which channel actually influenced conversions, not just which one generated clicks.
Example: How a Finance Company Used DiGGrowth
A mid-sized digital finance company was struggling with a common problem. Their marketing looked successful on the surface, but they could not clearly identify which campaigns were actually driving qualified loan applications.
They were running multiple channels at once:
- Paid search for loan products.
- Affiliate partnerships.
- Email remarketing campaigns.
- Organic content for financial education.
The issue was not lack of data. It was lack of clarity.
After implementing DiGGrowth, the team was able to unify all campaign data into a single AI-generated reporting layer.
Within a few reporting cycles, they noticed something important.
- Paid search was generating high traffic but low approval-quality leads.
- Email remarketing was contributing to a higher conversion rate than expected.
- Organic content was influencing early-stage decisions that were not previously tracked.
This changed how they allocated budget.
Instead of increasing spend on the highest-traffic channel, they shifted focus toward the channels driving actual approved applications. Over time, this improved their cost per acquisition and reduced wasted ad spend.
2. Microsoft Power BI: Enterprise Reporting With AI-Driven Intelligence
Microsoft Power BI is one of those tools that quietly sits at the center of many enterprise reporting systems. It is no longer just a dashboard builder. With AI capabilities built into it, it has become a platform that helps organizations move from static reporting to intelligent, interactive insights.
What makes it relevant in the AI report generation space is not only visualization. It is how quickly it can turn complex, messy datasets into structured insights that decision-makers can actually use.
Power BI combines data modeling, reporting, and AI-assisted insights into one ecosystem. It connects multiple business systems and transforms them into unified reports that update in real time.
The key shift is simple but important. Instead of analysts manually building reports, AI now helps surface patterns directly inside dashboards.
Key AI Features That Matter
- Natural language queries for instant reporting.
- AI-powered trend detection across datasets.
- Automated dashboard refresh without manual intervention.
- Deep integration with the Microsoft ecosystem, including Excel and Azure.
Pros and Cons
| Pros | Cons |
|---|---|
| Strong enterprise-level scalability. | Requires time to fully learn and configure. |
| Seamless integration with Microsoft tools. | Can feel complex for smaller teams without data expertise. |
| Reliable AI-assisted insights for large datasets. | Performance can depend on data setup quality. |
| Supports real-time dashboards and reporting. | Advanced features may require paid licensing tiers. |
Why It Fits in AI Report Generation
Power BI represents the enterprise side of AI reporting. It is not about replacing analysts but about giving them tools that reduce manual effort and increase insight depth.
In larger organizations where data lives across multiple systems, AI-driven reporting becomes less of a convenience and more of a necessity.
3. Tableau: Visual AI Reporting That Makes Data Easier to Understand
Tableau is often the tool people turn to when raw numbers are not enough. It focuses on one simple idea: if people can see the data clearly, they can understand it faster.
In the AI report generation space, Tableau stands out for how it blends visual storytelling with AI-assisted analytics. It does not just generate reports. It helps users explore data in a way that feels intuitive, even when the dataset is complex.
Key Features
- Drag-and-drop report creation for faster setup.
- AI-powered data suggestions and insights.
- Interactive dashboards with drill-down capabilities.
- Real-time collaboration across teams.
- Strong visual analytics for complex datasets.
Example: How a Healthcare Organization Uses Tableau
A healthcare provider uses Tableau to analyze patient admission trends across multiple hospitals.
Previously, teams relied on static monthly reports that often missed early warning signals.
Now, Tableau automatically visualizes:
- Seasonal spikes in patient admissions.
- Common conditions driving hospital visits.
- Department-wise resource utilization.
Doctors and administrators can quickly identify pressure points and adjust staffing or resources accordingly.
This shift helps reduce delays in decision-making and improves operational readiness.
Why It Fits in AI Report Generation
Tableau plays a key role in making AI-generated insights more accessible. It bridges the gap between complex data systems and human understanding.
In many organizations, it is not the lack of data that slows decisions. It is the difficulty of interpreting it quickly. Tableau helps remove that friction by turning AI insights into something people can actually see and act on.
4. Looker (Google Cloud): Structured AI Reporting for Teams That Care About Consistency
Google Cloud Looker is built for a very specific problem in reporting: inconsistency. When different teams define metrics differently, reporting stops being reliable. Looker focuses on fixing that before anything else.
Instead of treating reporting as separate dashboards built by different people, it creates a central data model that everyone uses.
The Core Idea Behind Looker
Looker is not trying to make reporting faster first. It is trying to make it consistent first.
Once the data definitions are locked in, AI can then layer insights on top of a stable foundation. That is what makes it different from many BI tools that focus only on visualization or automation.
What It Is Good At
- Centralized data modeling for consistent reporting logic.
- AI-assisted exploration on top of governed datasets.
- Embedded analytics inside products and platforms.
- Real-time querying through cloud infrastructure.
- Strong integration with Google Cloud ecosystem.
5. ThoughtSpot: When Reporting Starts With a Question, Not a Dashboard
ThoughtSpot changes something fundamental about how people use data. Most tools expect you to navigate dashboards. This one expects you to talk to your data.
That sounds simple, but it removes one of the biggest barriers in reporting: knowing where to look before you even start.
Instead of opening a pre-built report, users type a question in plain English and get an instant response backed by structured data.
So the experience feels less like analytics software and more like asking a very fast, very precise data assistant.
What This Feels Like in Real Use
A revenue head is not digging through filters or waiting for a BI analyst.
They are typing:
“Show me why Q2 conversions dropped in the Northeast region.”
And within seconds, they are looking at a breakdown that includes:
- Channel-wise performance changes.
- Funnel drop-off points.
- Customer segments that underperformed.
No dashboard hunting. No waiting in queues.
Where It Works Differently From Traditional BI Tools
Most reporting tools are built around structure first. ThoughtSpot is built around curiosity first.
That changes behavior inside teams:
- Business users explore data without relying on analysts.
- Insights become iterative instead of static.
This is where AI becomes more than automation. It becomes an interaction layer.
Pro Tip : This speed comes with a dependency. If the underlying data is messy or poorly structured, the answers lose reliability quickly. ThoughtSpot is powerful, but it does not fix bad data architecture. It amplifies whatever already exists.
6. Zoho Analytics: Practical AI Reporting for Growing Teams
Zoho Analytics often gets overlooked in conversations about enterprise BI, but that is exactly where it becomes interesting. It is built for teams that want structured reporting without the complexity or overhead of large-scale analytics systems.
In the AI report generation space, it plays a very practical role. It focuses less on heavy customization and more on making automated reporting accessible to small and mid-sized businesses.
What It Actually Does Well
Zoho Analytics brings together multiple data sources and converts them into scheduled, AI-assisted reports. The emphasis is on automation and simplicity rather than deep technical configuration.
It is particularly useful when teams want insights without depending heavily on data engineers or analysts.
Core Capabilities
- Automated data integration from business apps and spreadsheets.
- AI assistant that generates insights in plain language.
- Scheduled reporting for recurring business reviews.
- Dashboard creation with minimal setup effort.
- Cross-platform connectivity for sales, marketing, and finance data.
Example: How an E-Commerce Business Uses It
An online retail store uses Zoho Analytics to manage daily performance tracking.
Instead of manually pulling data from their website, payment gateway, and inventory system, everything flows into one dashboard.
Each morning, the founder receives an automated report showing:
- Best-selling products from the previous day.
- Cart abandonment trends.
- Inventory levels that need restocking.
What used to take hours of manual reporting now happens automatically before the workday begins.
Conclusion
Most reporting systems were never designed for how fast decisions need to happen today. They were built for documentation, not direction. That gap is what AI report generation is quietly closing.
What stands out across these tools is not just automation or speed. It is the shift in how teams interact with information. Reports are no longer waiting in folders or dashboards. They are being formed at the exact moment a question is asked.
But there is a subtle truth underneath all of this. AI does not simplify decision-making on its own. It only removes friction between data and clarity. If the data is fragmented, the insight is fragmented. If the structure is strong, the output becomes powerful.
That is where platforms like DiGGrowth become relevant in a more practical sense. Instead of treating reporting as a separate activity, it brings marketing data, attribution, and revenue context into a single flow that teams can actually act on.
The direction is already clear. Reporting is no longer something you prepare. It is something you continuously engage with.
If this is where your teams are heading, the next step is not adding more dashboards. It is removing the gap between data and action.
For deeper collaboration or to explore how this can be applied to your reporting setup, reach out at info@diggrowth.com.
Ready to get started?
Increase your marketing ROI by 30% with custom dashboards & reports that present a clear picture of marketing effectiveness
Start Free Trial
Experience Premium Marketing Analytics At Budget-Friendly Pricing.

Learn how you can accurately measure return on marketing investment.
How Predictive AI Will Transform Paid Media Strategy in 2026
Paid media isn’t a channel game anymore, it’s a chessboard. Search, social, programmatic, video, influencer, native,...
Read full post post
Don’t Let AI Break Your Brand: What Every CMO Should Know
AI isn’t just another marketing tool. It’s changing how we connect with customers, personalize content, and...
Read full post post
From Demos to Deployment: Why MCP Is the Foundation of Agentic AI
A quiet revolution is unfolding in AI. And it’s not happening inside research labs. For decades,...
Read full post postFAQ's
AI report generation is the process of using artificial intelligence to automatically collect, structure, and interpret data into meaningful reports. Instead of manually building dashboards or spreadsheets, AI tools generate insights in real time based on connected data sources.
Traditional reporting requires manual effort to pull data, clean it, and build dashboards. AI report generation automates much of this process and focuses on highlighting insights, trends, and anomalies instead of just displaying raw numbers.
Marketing, sales, finance, and operations teams benefit the most because they rely heavily on fast, accurate reporting. These tools help reduce reporting delays and improve decision-making speed across departments.
No, they do not replace data analysts. They reduce repetitive reporting work and allow analysts to focus more on strategy, interpretation, and deeper analysis rather than manual report building.
Businesses should evaluate data quality, integration needs, team size, and reporting complexity. A tool is only effective if it works well with existing systems and supports consistent, reliable data structures.