
Top AI Analytics Platforms You Should Consider In 2026 and Beyond
Organizations generate vast data but struggle to turn it into decisions. This article explains AI analytics platforms, compares top tools, and outlines how they improve clarity, speed, and decision-making across marketing, sales, and product teams in 2026.
You are not short on data. You are short on clarity.
Most teams today are tracking everything. Campaigns, customer behaviour, revenue signals, product usage. Yet when it is time to make a decision, things still feel uncertain. Reports are delayed. Insights are scattered. Teams rely on assumptions more than they admit.
This is the gap AI analytics platforms are stepping into.
Instead of asking you to dig through dashboards, they surface what matters. Instead of showing what happened, they help you understand what is likely to happen next. That shift changes how decisions are made across teams.
Take a simple example. A marketing team runs five campaigns. Traditional analytics tells them which one performed best last month. An AI analytics platform tells them which campaign is likely to drive conversions next week and where to adjust budget today.
That difference is not small. It is operational.
The decision is no longer about adopting AI in analytics. It is about choosing a platform that fits your business workflows and decision-making needs.
Key Takeaways
- AI analytics platforms shift teams from reporting past performance to acting on future opportunities.
- The right platform depends more on your use case than on popularity or feature volume.
- Real value comes from reducing the gap between data and decisions, not just visualizing data.
- Accessibility matters as much as capability, especially for cross-functional adoption.
- Platforms like DiGGrowth stand out by connecting insights directly to revenue outcomes, not just metrics.
What Are AI Analytics Platforms And Why Businesses Are Moving To Them
Most analytics tools tell you what already happened.
AI analytics platforms go further. They show what is happening now and what is likely to happen next.
They combine data processing with machine learning to analyze large datasets, detect patterns, and surface insights automatically. This reduces the need for constant manual analysis.
Here is the difference in simple terms:
| Traditional Analytics | AI Analytics Platforms |
|---|---|
| Focuses on past data | Anticipates future outcomes |
| Requires manual analysis | Surfaces insights automatically |
| Uses static dashboards | Delivers real-time intelligence |
| Built for analysts | Accessible to all teams |
The shift becomes clearer in real scenarios.
A sales report might highlight a drop in conversions.
An AI analytics platform identifies the cause and signals where to act.
A marketing team might track campaign performance.
An AI analytics platform predicts which campaigns will perform next and where to adjust budget.
This is why businesses are moving in this direction.
It is not about adding another tool. It is about reducing the gap between data and decisions.
Teams can act faster, spot opportunities earlier, and make decisions with more confidence. Instead of spending time searching for insights, they can focus on using them.
Top AI Analytics Platforms You Should Consider In 2026 And Beyond
Choosing the right platform is not about picking the most popular name. It is about finding what actually works for your use case.
Some tools are built for marketers. Some are designed for data teams. Others focus on enterprise-scale analytics. The difference shows in how insights are delivered and how easily your team can act on them.
1. DiGGrowth
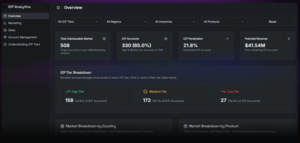
DiGGrowth is an AI-driven marketing analytics platform designed to link marketing performance directly with pipeline and revenue outcomes. It combines attribution, automation, and AI-Powered ICP Analytics to help businesses identify, refine, and prioritize their ideal customer profile using real conversion data.
Instead of relying on static definitions, it continuously learns from customer behavior, campaign performance, and revenue outcomes to highlight which accounts are most likely to convert.
What Makes It Different
Most analytics tools stop at reporting performance. DiGGrowth focuses on why performance is happening and what to do next .
It combines attribution, predictive analytics, and AI agents to continuously optimize campaigns, pipeline, and revenue visibility.
Key Features
- AI-Powered ICP Analytics: Dynamically identifies high-fit accounts using historical and real-time data.
- Multi-Touch Attribution: Tracks the full customer journey across channels.
- Unified Data Layer: Brings CRM, marketing, and product data into one view.
- Real-Time Revenue Insights: Connects campaigns directly to pipeline and revenue impact.
- Conversational Analytics: Allows users to query data using natural language.
Real-World Example
An essential business services organization faced a common problem after multiple acquisitions. Their marketing data was spread across platforms, brands, and systems, making it difficult to measure performance or make timely decisions.
After implementing DiGGrowth:
- Marketing data was consolidated into a single unified view.
- Manual reporting was reduced through automation.
- Campaign tracking became more accurate and actionable.
Results:
- 23% increase in tracked marketing-influenced opportunities.
- $800K in additional closed-won revenue attributed to marketing.
- $1.3M increase in marketing-influenced pipeline.
With better visibility and AI-driven insights, the team could identify underperforming campaigns, reallocate budgets, and improve overall efficiency.
Unique Value
DiGGrowth stands out for its ability to move beyond reporting and focus on who to target and where to invest . Its ICP analytics continuously refines target accounts, helping teams focus on opportunities that are more likely to convert instead of relying on broad segmentation.
2. Microsoft Power BI
Microsoft Power BI is a widely used AI-enabled analytics platform that helps businesses visualize data, generate insights, and make informed decisions. It combines data modeling, interactive dashboards, and built-in AI features to make analytics accessible across teams.
It is especially useful for organizations already working within the Microsoft ecosystem, as it integrates seamlessly with tools like Excel, Azure, and Dynamics.
Key Features
- Interactive Dashboards: Creates dynamic, customizable reports for real-time insights.
- Natural Language Query (Q&A): Allows users to ask questions and get instant visual answers.
- AI-Powered Insights: Identifies trends, anomalies, and patterns automatically.
- Microsoft Ecosystem Integration: Connects easily with Excel, Azure, and other Microsoft tools.
- Data Modeling: Enables structured analysis across multiple data sources.
Pros And Cons
| Pros | Cons |
|---|---|
| Strong integration with Microsoft tools. | Can become complex with large-scale data models. |
| Cost-effective for most businesses. | Performance may slow with very large datasets. |
Example Use Case
A finance team uses Power BI to track revenue performance across regions.
Instead of manually compiling reports, they build a live dashboard that updates automatically. Leadership can view trends, compare performance, and make decisions without waiting for monthly reports.
3. Tableau
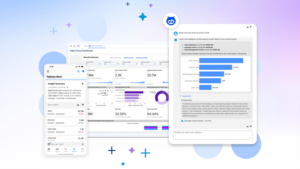
Tableau is a leading AI-powered analytics platform known for its advanced data visualization capabilities. It helps organizations turn complex datasets into clear, interactive visuals that support faster and more confident decision-making.
With the addition of AI features, Tableau goes beyond dashboards to surface insights, highlight trends, and guide users toward meaningful conclusions.
Key Features
- Advanced Data Visualization: Creates highly interactive and customizable charts and dashboards.
- AI-Driven Insights (Tableau Pulse / Einstein AI): Surfaces trends and key drivers automatically.
- Drag-And-Drop Interface: Simplifies dashboard creation without heavy coding.
- Data Blending: Combines multiple data sources into a single view.
- Real-Time Analytics: Updates dashboards with live data feeds.
How It Benefits Your Organization
- Improves data understanding across teams.
- Helps leadership quickly interpret trends and performance.
- Enhances storytelling in presentations and reporting.
- Reduces time spent analyzing complex datasets.
Example Use Case
A retail company uses Tableau to analyze customer purchasing behavior across different regions.
By visualizing trends in an interactive dashboard, the team can quickly identify which products perform best in specific locations and adjust inventory and marketing strategies accordingly.
4. ThoughtSpot
ThoughtSpot is an AI-powered analytics platform designed around search and natural language queries. It allows users to ask questions in plain English and get instant, data-backed answers without building dashboards or writing queries.
It is built to make analytics accessible to business users, not just data teams.
Key Features
- Search-Driven Analytics: Allows users to query data using natural language.
- AI-Powered Insights (SpotIQ): Automatically identifies trends, anomalies, and key drivers.
- Live Query Engine: Delivers real-time results from large datasets.
- Self-Service Analytics: Enables non-technical users to explore data independently.
- Cloud-Native Architecture: Supports scalability and fast performance.
Key Benefits
- Reduces dependency on data teams.
- Speeds up access to insights.
- Makes analytics accessible across departments.
- Improves decision-making with real-time data.
Example Use Case
A sales team wants to understand which regions are underperforming.
Instead of waiting for a report, they type a query into ThoughtSpot and instantly see performance breakdowns, trends, and contributing factors. This allows them to take action immediately.
Pro Tip : Focus on improving data quality and consistency across sources. Clean, well-structured data significantly improves the accuracy and relevance of insights generated by ThoughtSpot.
5. Google Cloud Vertex AI
Google Cloud Vertex AI is a comprehensive AI and machine learning platform designed to build, deploy, and scale advanced analytics models. It is built for organizations that want to move beyond dashboards and develop custom AI-driven insights tailored to their data.
It combines data engineering, model training, and deployment into a single environment, making it easier to operationalize AI across the business.
Key Features
- End-To-End ML Platform: Supports data preparation, model training, and deployment.
- AutoML Capabilities: Enables model building without deep machine learning expertise.
- Custom Model Training: Allows advanced teams to build tailored AI models.
- Integration With Google Cloud: Connects seamlessly with BigQuery and other services.
- Scalable Infrastructure: Handles large datasets and high-performance workloads.
Example Use Case
An e-commerce company uses Vertex AI to predict customer churn and personalize product recommendations.
By analyzing user behavior and purchase patterns, the platform helps identify at-risk customers and triggers targeted retention campaigns.
6. IBM Watson Analytics
IBM Watson Analytics is an AI-powered analytics platform designed to automate data analysis and deliver predictive insights. It focuses on simplifying complex analytics tasks such as data preparation, pattern detection, and forecasting.
It is well suited for organizations that want to reduce manual effort and rely more on automated intelligence.
Key Features
- Automated Data Preparation: Cleans and organizes data with minimal manual input.
- Predictive Analytics: Identifies trends and forecasts future outcomes.
- AI-Driven Insights: Surfaces patterns and anomalies automatically.
- Natural Language Interaction: Allows users to ask questions and get insights easily.
- Data Visualization: Presents insights through clear and interactive visuals.
Pros And Cons
| Pros | Cons |
|---|---|
| Strong automation reduces manual effort. | Can have a learning curve for new users. |
| Built-in predictive analytics capabilities. | Less flexible for highly custom use cases. |
| Good for handling complex datasets. | Integration can require setup effort. |
Example Use Case
A healthcare organization uses Watson Analytics to analyze patient data and identify risk patterns.
By detecting trends early, the organization can improve patient outcomes and allocate resources more effectively.
Comparison Of Top AI Analytics Platforms
| Platform | Best For | Core Strength | Ideal Use Case |
|---|---|---|---|
| DiGGrowth | Marketing and RevOps teams | AI-powered ICP analytics and revenue attribution | Identifying high-converting accounts and optimizing marketing ROI |
| Microsoft Power BI | Small to enterprise teams | Data visualization and reporting | Building dashboards and tracking business performance |
| Tableau | Data analysts and business teams | Advanced data visualization | Analyzing complex datasets and creating visual insights |
| ThoughtSpot | Business users and non-technical teams | Search-driven analytics | Getting instant insights using natural language queries |
| Google Cloud Vertex AI | Data science and engineering teams | Custom AI model development | Building predictive models and advanced AI solutions |
| IBM Watson Analytics | Enterprises focused on automation | Automated analytics and predictions | Reducing manual analysis and generating predictive insights |
Conclusion
Clarity is no longer a nice-to-have. It is what separates teams that move fast from those that stay reactive.
AI analytics platforms are not just changing how data is analyzed. The difference shows up in how quickly teams respond, how confidently they allocate budgets, and how clearly they understand what is driving growth.
That is where platforms like DiGGrowth shift the equation. Instead of stopping at insights, they connect data directly to pipeline and revenue, helping teams focus on what actually moves the business forward.
The real advantage is not having more data. It is knowing what to do with it, when it matters.
If you are evaluating how to bring clarity into your marketing and revenue decisions, this is where the conversation starts.
Reach out at info@diggrowth.com and explore how your analytics can move from reporting to real impact.
Ready to get started?
Increase your marketing ROI by 30% with custom dashboards & reports that present a clear picture of marketing effectiveness
Start Free Trial
Experience Premium Marketing Analytics At Budget-Friendly Pricing.

Learn how you can accurately measure return on marketing investment.

How Predictive AI Will Transform Paid Media Strategy in 2026
Paid media isn’t a channel game anymore, it’s a chessboard. Search, social, programmatic, video, influencer, native,...
Read full post post
Don’t Let AI Break Your Brand: What Every CMO Should Know
AI isn’t just another marketing tool. It’s changing how we connect with customers, personalize content, and...
Read full post post
From Demos to Deployment: Why MCP Is the Foundation of Agentic AI
A quiet revolution is unfolding in AI. And it’s not happening inside research labs. For decades,...
Read full post postFAQ's
AI analytics platforms use machine learning and automation to analyze data, identify patterns, and generate insights without heavy manual effort. They help teams understand what is happening and predict what is likely to happen next.
Traditional tools focus on historical data and require manual analysis. AI analytics platforms automate insights, provide real-time intelligence, and offer predictive recommendations to support faster decision-making.
Platforms like DiGGrowth are designed specifically for marketing and RevOps teams. They connect campaign performance directly to pipeline and revenue, making it easier to prioritize high-impact activities.
Not always. Some platforms are built for business users with features like natural language queries and automated insights. However, advanced platforms such as Google Cloud Vertex AI may require data science or engineering expertise.
Start by identifying your primary use case, whether it is marketing performance, data visualization, or predictive modeling. Then evaluate ease of use, integrations, and how well the platform aligns with your team’s workflow and decision-making needs.