
AI-Driven Reporting and Dashboards: Transforming Business Analytics
AI-driven reporting and dashboards automate data analysis, detect trends, and provide real-time insights. Leverage AI-powered analytics to optimize strategies, improve efficiency, and make proactive business decisions.
AI-powered analytics automates the process of transforming raw data into actionable insights. These systems process vast datasets, recognize patterns, and deliver real-time reporting with predictive capabilities. Businesses no longer rely solely on historical reports; AI-driven tools forecast trends, optimize strategies, and suggest data-backed decisions.
Data serves as the foundation for every modern business decision. Organizations generate vast amounts of information daily from customer interactions, operational processes, and market fluctuations. Traditional analytics tools struggle to extract meaningful insights from this complexity, leading to missed opportunities. AI-driven reporting and dashboards bridge this gap by continuously analyzing new information, identifying shifts, and providing decision-makers with clear, real-time perspectives.
Advanced analytics tools integrate artificial intelligence, machine learning, and automated data visualization. Platforms such as Power BI, Tableau, and Google Looker incorporate AI-driven features, streamlining the analysis process. These tools automate reporting, enhance anomaly detection, and provide predictive modeling, allowing businesses to respond proactively instead of reactively. With the expansion of AI’s capabilities, organizations can move beyond static reports and embrace dynamic, adaptive data insights.
Key Takeaways
- AI-powered dashboards automate data analysis, delivering real-time insights and predictive recommendations that enhance decision-making efficiency.
- Advanced AI models detect patterns, anticipate trends, and generate proactive business strategies, helping organizations anticipate market shifts.
- AI-driven BI tools customize reports based on user roles and preferences, integrating natural language processing (NLP) to simplify data interpretation.
- Implementing AI-powered reporting tools necessitates leadership buy-in, employee training, and continuous iteration based on user feedback for seamless integration.
The Role of Business Intelligence (BI) Tools in AI-Driven Dashboards
Integration with Data Sources
BI tools connect with structured and unstructured data sources, including databases, cloud storage, and real-time IoT feeds. AI enhances these integrations by automating data extraction, transformation, and loading (ETL) processes. APIs and connectors establish seamless data flow between platforms, ensuring continuous updates without manual intervention.
Modern BI platforms support integrations with CRMs, ERPs, and data warehouses. AI optimizes data mapping and schema recognition, reducing setup time. Advanced BI tools employ automated data cleansing, identifying inconsistencies and filling gaps using machine learning models.
Customization and Personalization Features
AI-driven dashboards adapt to user preferences, delivering relevant insights based on historical interactions and behavioral patterns. Role-based access control (RBAC) refines dashboard views, allowing executives, analysts, and operational teams to access tailored metrics.
Natural Language Generation (NLG) translates complex analytics into textual summaries, making reports more accessible. Personalized alerts use predictive models to highlight anomalies, prompting users to act proactively. Drag-and-drop interfaces combined with AI-powered recommendations simplify report creation, suggesting the most relevant visualizations based on the dataset.
The Shift from Traditional BI to AI-Driven Insights
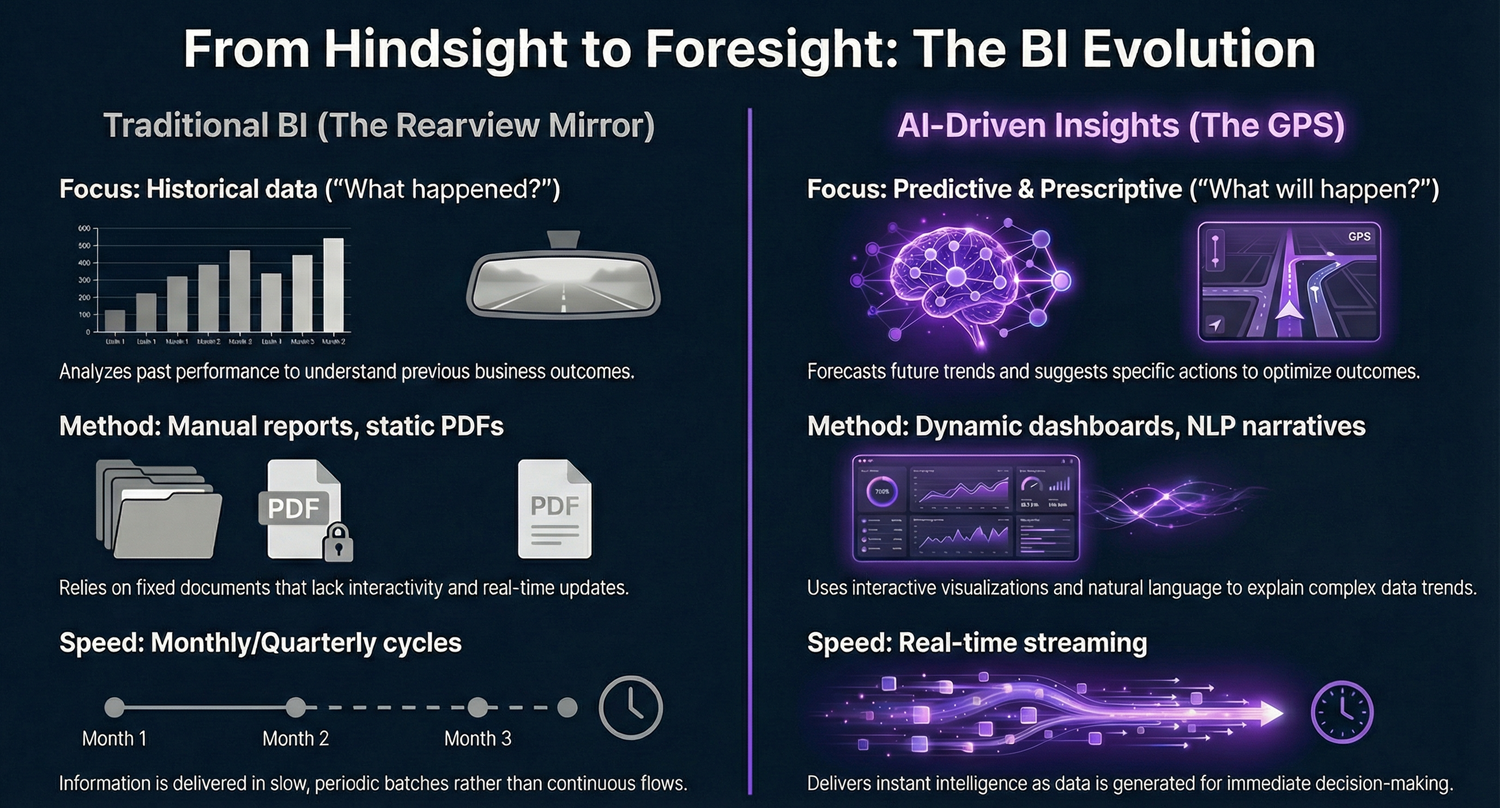
Traditional BI tools relied on predefined queries and manual report generation. AI-driven analytics automate insight generation, identifying correlations and trends without human intervention. Machine learning models refine predictive accuracy over time, adapting to changing business conditions.
Descriptive analytics has given way to prescriptive suggestions, enabling decision-makers to implement AI-recommended strategies. Automated anomaly detection replaces static dashboards, continuously scanning for deviations and generating instant alerts.
Real-time processing further differentiates AI-driven BI. Traditional reporting operated on historical data, while modern systems integrate live feeds, supporting agile responses to market fluctuations.
Advancements in Data Visualization Techniques
Interactive Visualization for Enhanced User Interaction
AI-driven reporting platforms integrate interactive visualization techniques that allow users to manipulate data dynamically. Features like drill-down capabilities, hover-over tooltips, and adjustable timeframes create an immersive analytical experience. These tools enable users to explore large datasets visually, uncovering patterns and anomalies without requiring extensive technical expertise.
For example, heatmaps can highlight operational inefficiencies by displaying real-time shifts in key performance indicators. Scatter plots with adjustable filters allow trend analysis across multiple dimensions, facilitating deeper insights. Interactive dashboards update in response to user inputs, refining the data in real-time to focus on specific business metrics.
Responsive Design for Mobile Accessibility
The demand for real-time analytics extends to mobile devices, requiring AI-driven dashboards to incorporate responsive design. Scalable vector graphics (SVGs) and adaptive layouts ensure data remains legible across different screen sizes. This flexibility allows executives and analysts to access insights from smartphones or tablets without losing clarity or functionality.
Progressive web applications (PWAs) and cloud-based reporting solutions deliver seamless mobile experiences by optimizing loading speeds and enabling touch-based interactions. Gesture-based navigation, such as pinch-to-zoom and swipe-to-scroll functionalities, enhances usability. As a result, decision-makers gain instant access to critical metrics, reducing the time between insight generation and strategic action.
Visualization as a Tool for Immediate Insight Generation
Modern AI-driven dashboards transform raw data into instantly comprehensible formats. Storytelling through visual elements such as dynamically updated infographics and animated trend lines-simplifies complex datasets. Automated anomaly detection highlights outliers within charts, alerting analysts to discrepancies before they escalate.
- Real-time data streaming:
- AI-assisted chart selection:
- Context-aware reporting:
AI-powered visualizations refresh automatically, ensuring businesses access up-to-the-minute performance metrics.
Algorithms recommend the most effective visualization format based on dataset characteristics, eliminating guesswork.
Dashboards display correlation insights, suggesting causative relationships between variables.
These innovations accelerate decision-making processes by eliminating the need for manual data interpretation. Users can focus on strategic responses rather than spending time analyzing static reports.
Pro Tip- Leverage AI-assisted chart selection to automatically choose the best visualization for your data, ensuring clarity and faster insights without manual adjustments.
Machine Learning and Predictive Analytics in Reporting
Automated Insights Generation through AI
AI models analyze vast datasets, detect patterns, and generate insights without manual intervention. These systems recognize correlations and anomalies, transforming raw data into actionable intelligence. Machine learning algorithms categorize information, identify trends, and generate real-time summaries.
Natural language processing (NLP) enhances automation by enabling AI to translate complex data findings into comprehensible reports. Instead of sifting through extensive dashboards, users receive concise explanations that highlight key performance changes. A retailer, for example, can receive AI-generated insights pinpointing a sudden sales drop, its potential causes, and recommended corrective actions.
Real-time Data Processing for Timely Decision-Making
Stream processing frameworks, such as Apache Kafka and Flink, allow AI-driven dashboards to continuously ingest and process data. Instead of batch analysis, businesses access live insights, enabling faster responses to market shifts. A financial institution, for instance, can detect fraudulent transactions within milliseconds and initiate preventive measures before losses escalate.
Machine learning models enhance real-time analysis by continuously refining data interpretation. Anomaly detection algorithms flag inconsistencies instantly, preventing operational disruptions. Traffic management systems leverage AI-powered real-time reporting to adjust signal timings dynamically, reducing congestion.
Predictive Analytics for Proactive Business Strategies
Predictive analytics models, built on machine learning techniques such as regression analysis and decision trees, anticipate future trends. These models base forecasts on historical and live data, improving demand planning, risk assessment, and resource allocation.
- Customer Churn Prediction:
- Sales Forecasting:
- Supply Chain Optimization:
AI analyzes user behavior to identify disengagement patterns. Businesses implement retention strategies before customers leave.
Time series models predict revenue fluctuations, guiding pricing and inventory decisions.
Machine learning improves demand forecasting by analyzing production cycles, economic indicators, and real-time logistics data.
In healthcare, predictive analytics facilitate early disease detection by analyzing patient history, genetic markers, and environmental factors. Hospitals use AI-driven reporting to anticipate admission rates and optimize staff and resource allocation.
Pro Tip- Implement real-time AI-driven anomaly detection to proactively address issues before they impact operations, ensuring seamless business performance and risk mitigation.
Natural Language Processing (NLP) for Narrative Reporting
Explaining Analytics Through Natural Language Generation
Traditional dashboards present data visually, but interpreting complex analytics still requires expertise. Natural Language Processing (NLP) changes this by using Natural Language Generation (NLG) to convert structured data into plain-language summaries. Instead of manually analyzing charts and graphs, users receive automated narrative explanations that highlight key trends, anomalies, and insights.
NLG-driven reporting enables businesses to generate real-time summaries without human intervention. For instance, instead of a static sales report, an AI system can generate a sentence such as, “Q2 revenue increased by 12.4% compared to the previous quarter, driven by a 20.8% growth in North America.” This eliminates ambiguity and improves decision-making speed.
Personalizing Reports for Various Audiences
Different stakeholders require tailored insights. Executives prioritize high-level summaries, while analysts need deep dives into specifics. NLP systems dynamically adjust reporting language and level of detail based on the user’s role and preferences.
- C-Suite Executives:
- Department Managers:
- Data Analysts:
High-level summaries focusing on revenue, operational efficiency, and market trends.
Mid-level analyses with KPI breakdowns relevant to department performance.
Detailed reports including granular data sources, statistical trends, and predictive insights.
By customizing narratives, AI-powered reporting ensures that each stakeholder receives relevant, actionable insights without information overload.
Enhancing Client Understanding Through Narrative Insights
Not all users possess expertise in data interpretation. NLP bridges this gap by simplifying complex financial, operational, or market analyses into understandable language. For example, an AI-driven investment report might translate technical figures into a statement like, “Your portfolio’s performance improved by 7.5% due to strong gains in the technology sector.”
Beyond internal use, customer-facing applications benefit from NLP-generated explanations. Financial services, healthcare, and insurance sectors leverage NLG to provide clients with clear breakdowns of policies, transactions, or medical reports, reducing confusion and enhancing customer experience.
Pro Tip- Leverage NLP-driven reporting to tailor insights for different stakeholders, ensuring clarity and relevance while reducing the time spent interpreting complex data.
Enhancing Decision Support Systems (DSS) with AI
Evolving DSS Through AI and Machine Learning
AI-powered Decision Support Systems (DSS) integrate machine learning algorithms to refine data analysis and improve decision-making precision. Traditional DSS relied on static datasets and pre-defined models, but AI-driven systems adapt in real-time as new data streams in. This adaptability reduces reliance on manual adjustments, optimizing outcomes based on evolving business scenarios.
Machine learning enhances DSS by identifying patterns in historical data and predicting future trends. For instance, regression models estimate sales performance based on seasonal variation, while classification algorithms flag high-risk financial transactions. Reinforcement learning further strengthens AI-enabled DSS by continuously adjusting recommendations based on feedback from user interactions.
Providing Actionable Insights for Strategic Decisions
AI-driven DSS moves beyond data aggregation and visualization to generate prescriptive insights. Rather than presenting raw figures, these systems analyze dependencies within data points, offering strategic recommendations. For example, AI can suggest optimal pricing strategies based on real-time market fluctuations, customer demand, and competitor pricing models.
Sentiment analysis, powered by natural language processing (NLP), gauges customer feedback through reviews and social media. By categorizing sentiment trends, executives gain clarity on brand perception, allowing proactive adjustments to marketing strategies. Anomaly detection further strengthens risk assessment by identifying inconsistencies in financial records, minimizing fraud exposure before significant losses occur.
Custom AI Dashboards as a Collaborative Tool for Decision Support
Executive teams and analysts require dashboards that align with specific business objectives. Custom AI-driven dashboards allow users to configure KPI tracking, automate alerts, and generate predictive models tailored to departmental needs. These dashboards go beyond static reporting by incorporating real-time updates and interactive elements for deeper exploration.
- Automated Scenario Modeling:
- Collaborative Decision-Making:
- Adaptive Insights:
AI simulates multiple outcome scenarios based on historical data and emerging trends.
Shared dashboards enable multiple stakeholders to contribute insights, refining strategies in a collective workspace.
Recommendation engines refine suggestions based on user interaction patterns, learning from previous decision-making behaviors.
By integrating AI into DSS, organizations enhance decision accuracy, streamline analytical processes, and foster a data-driven culture where strategy adapts dynamically to new information.
Pro Tip- Implement AI-driven DSS with interactive dashboards and automated scenario modeling to enhance strategic agility and improve decision accuracy in real-time.
Automated Insights and Their Role in Fostering Data-Driven Culture
Ingraining Analytics into the Business Fabric
AI-driven reporting embeds analytics into daily operations by eliminating manual data interpretation. Automated insights ensure that decision-makers receive real-time, contextualized data without needing deep technical expertise. By integrating AI-powered dashboards with operational workflows, businesses operationalize data usage across departments.
- Finance teams use AI-generated insights to detect cost inefficiencies and predict cash flow trends.
- Marketing departments leverage predictive models to optimize campaign spending and audience engagement.
- HR analytics platforms provide real-time workforce insights, improving talent retention and performance management.
Embedding automated insights into core processes helps companies transition from intuition-based decisions to structured, evidence-backed strategies. Organizations integrating AI into decision-making experience a 5-6% increase in productivity, according to McKinsey’s 2023 Global Survey on AI.
Transformative Potential of Automated Insight Generation
Traditional reporting structures rely on static data visualization, requiring users to manually interpret trends. AI-driven dashboards eliminate that bottleneck by delivering contextualized recommendations, anomaly detection, and automated forecasting.
Unlike conventional BI tools, AI-powered systems proactively surface relevant insights without user prompting. These platforms leverage historical trends, real-time data streams, and external factors to refine predictions continuously. Gartner estimates that by 2025, 90% of business leaders will use AI-generated insights to guide strategy, compared to 30% in 2019.
Key benefits of automated insights include:
- Proactive decision-making:
- Operational efficiency:
- Personalized analytics:
AI detects emerging trends ahead of human analysis.
Automated alerts reduce dependency on manual reporting cycles.
Adaptive algorithms adjust insights based on user behavior and preferences.
By leveraging AI-driven insights, organizations reduce decision-making latency while maintaining data integrity. These systems identify inefficiencies, flag potential risks, and optimize workflows with minimal human intervention.
Overcoming Adoption Challenges and Change Management
Even with demonstrable benefits, organizations struggle to transition from traditional analytics to AI-driven reporting. Resistance stems from technical debt, legacy system compatibility, and workforce hesitancy.
Successful AI adoption relies on structured change management strategies:
- Clear executive buy-in:
- User training programs:
- Progressive integration:
Leadership commitment accelerates AI-driven cultural shifts.
Practical workshops familiarize employees with AI-powered dashboards.
Gradual onboarding mitigates resistance while phasing out redundant workflows.
Firms investing in AI literacy witness a higher success rate in digital transformations. A 2023 Deloitte survey highlights that 87% of companies with structured AI adoption frameworks outperform competitors in data utilization.
By embedding AI-generated insights into everyday decision-making, enterprises cultivate a data-driven culture, improving agility and strategic execution.
Pro Tip- Foster a data-driven culture by integrating AI insights into daily workflows, providing user-friendly training, and securing leadership buy-in to accelerate adoption and maximize impact.
Utilizing Real-Time Data for Dynamic Business Environments
The Vital Role of Real-Time Data Processing in Rapid Decision-Making
Immediate access to accurate data enables businesses to react swiftly to market changes, minimizing risks and maximizing opportunities. AI-driven dashboards continuously ingest and process live data streams, applying sophisticated algorithms to detect anomalies, trends, and correlations in real-time.
Financial institutions use AI-powered analytics to monitor transactions for fraudulent activities as they occur. Retailers adjust pricing dynamically based on market demand and competitor movements. Real-time processing ensures decision-making aligns with evolving operational conditions.
Integrating IoT and Other Real-Time Data Sources into AI Dashboards
IoT devices, social media feeds, transaction logs, and sensor data feed into AI dashboards, providing a comprehensive view of business operations. Connected supply chains leverage IoT data to optimize logistics by predicting delays and rerouting shipments before disruptions occur.
Industries such as manufacturing employ AI-driven monitoring systems to track equipment performance. Sensors embedded in machinery transmit data continuously, allowing AI models to detect patterns indicative of potential failures. Preventative maintenance reduces downtime and lowers operational costs.
Agriculture implements real-time data from weather satellites, soil sensors, and automated irrigation systems within AI dashboards. Farmers make immediate adjustments to resource allocation based on live environmental data, improving yields and sustainability.
Monitoring KPIs and Metrics On-The-Go for Instant Insights
AI-driven dashboards provide mobile accessibility, ensuring executives and teams can assess key performance indicators (KPIs) from any location. Customizable alerts notify decision-makers of critical deviations from expected metrics.
- Sales Teams:
- Healthcare Administrators:
- Marketing Departments:
Track live revenue figures, customer engagement metrics, and inventory levels.
Monitor patient flow in hospitals, ensuring optimal resource allocation.
Analyze real-time campaign performance, adjusting strategies to optimize conversion rates.
Automated AI-driven insights ensure businesses respond to emerging trends in real-time, keeping operations aligned with strategic objectives.
Pro Tip- Leverage real-time AI dashboards to automate alerts for critical KPIs, ensuring swift, data-driven decisions that keep your business agile in dynamic market conditions.
Addressing Adoption Challenges and Change Management
Strategies for Effective Change Management in Introducing AI Tools
- Leadership Involvement:
- Phased Implementation:
- Cross-Functional Collaboration:
- Transparency in Data and Insights:
Clear communication from executives establishes AI adoption as a strategic priority. Leaders must demonstrate commitment through active engagement and resource allocation.
Gradually replacing legacy systems with AI-powered dashboards reduces operational risks. A pilot phase allows teams to test functionality and provide feedback.
Involving stakeholders from different departments ensures diverse business needs are addressed. IT, finance, and operations teams must align on objectives and expectations.
Employees often distrust AI-driven analytics due to perceived complexity. Clearly explaining data sources, algorithms, and decision-making logic builds confidence.
Training and Support for Seamless Adoption
Even sophisticated AI tools require comprehensive onboarding programs to maximize usability. A combination of formal training and ongoing support mitigates adoption challenges.
- Role-Based Training:
- Hands-On Workshops:
- On-Demand Learning Resources:
- Helpdesk and Community Forums:
Customizing sessions based on user roles enhances learning efficiency. Analysts, managers, and executives need tailored instruction on dashboard functionalities relevant to their responsibilities.
Interactive training improves retention by allowing users to engage directly with AI-powered dashboards. Practical exercises demonstrate real-world applications and functionalities.
Knowledge bases, video tutorials, and AI-guided assistants provide continuous support. Users can resolve issues independently, reducing reliance on IT teams.
A centralized support system ensures employees receive timely assistance. Peer-led discussions in internal forums encourage best practice sharing.
Consulting Client Feedback to Improve User Experience
Iterative refinement based on user input enhances AI-driven reporting tools. Organizations that actively incorporate employee feedback achieve higher adoption rates and better system usability.
- Usage Analytics:
- Regular Surveys and Feedback Loops:
- User Advisory Panels:
- Continuous Iteration:
Tracking feature utilization helps identify areas where users struggle. Insights from dashboard activity inform necessary interface improvements or additional training needs.
Collecting qualitative responses through questionnaires and interviews provides direct insights into user satisfaction and pain points.
Engaging power users in product development discussions aligns dashboard enhancements with business needs.
AI-driven platforms should evolve in response to user behavior. Frequent software updates address inefficiencies and incorporate new advancements.
Maximizing Business Intelligence with AI-Driven Reporting
Transforming Data into Actionable Insights
AI-driven reporting and dashboards streamline data analysis, automate insights, and enhance decision-making. Machine learning models detect patterns in real-time, reducing the reliance on manual interpretation. Predictive analytics forecast trends, giving organizations a competitive edge. Businesses that implement AI-powered dashboards increase efficiency by eliminating redundant processes and improving data accuracy.
Building a Culture of Data Literacy
Adopting AI in reporting requires more than just technology integration. Employees must develop data literacy to interpret automated insights correctly. Organizations investing in training programs empower teams to make informed decisions. Interactive dashboards with natural language queries simplify access to insights, making analytics accessible to non-technical users.
Implementing AI-Powered Business Tools
Deploying AI-driven reporting tools demands a structured approach. Companies must assess data quality, integrate AI models strategically, and establish governance frameworks to maintain security. Customizable dashboards tailored to industry-specific metrics improve relevance. Continuous optimization ensures that AI solutions remain aligned with evolving business objectives.
Want to learn more about the use of AI-driven reporting and dashboards?
Drop us a line at info@diggrowth.com to get started.
Ready to get started?
Increase your marketing ROI by 30% with custom dashboards & reports that present a clear picture of marketing effectiveness
Start Free Trial
Experience Premium Marketing Analytics At Budget-Friendly Pricing.

Learn how you can accurately measure return on marketing investment.

How Predictive AI Will Transform Paid Media Strategy in 2026
Paid media isn’t a channel game anymore, it’s a chessboard. Search, social, programmatic, video, influencer, native,...
Read full post post
Don’t Let AI Break Your Brand: What Every CMO Should Know
AI isn’t just another marketing tool. It’s changing how we connect with customers, personalize content, and...
Read full post post
From Demos to Deployment: Why MCP Is the Foundation of Agentic AI
A quiet revolution is unfolding in AI. And it’s not happening inside research labs. For decades,...
Read full post postFAQ's
Traditional BI tools rely on predefined queries and manual data analysis, while AI-driven reporting automates insights using machine learning and real-time analytics. AI tools detect trends, forecast outcomes, and generate actionable recommendations without human intervention.
AI-powered dashboards provide real-time data visualization, predictive analytics, and automated anomaly detection. They enhance decision-making, reduce manual reporting efforts, and improve operational efficiency by identifying trends and insights faster than traditional methods.
Yes, AI-driven reporting tools integrate seamlessly with various data sources, including CRM, ERP, cloud storage, and IoT systems. APIs and connectors enable continuous data flow, ensuring that insights remain current and actionable.
AI enhances data visualization by automatically selecting the most effective chart types, identifying key trends, and providing interactive dashboards. It also translates complex data into natural language summaries, making insights accessible to non-technical users.
Common challenges include resistance to change, data privacy concerns, and the need for employee training. Businesses can overcome these obstacles by securing leadership support, implementing phased AI adoption, ensuring compliance with data regulations, and providing comprehensive user training programs.