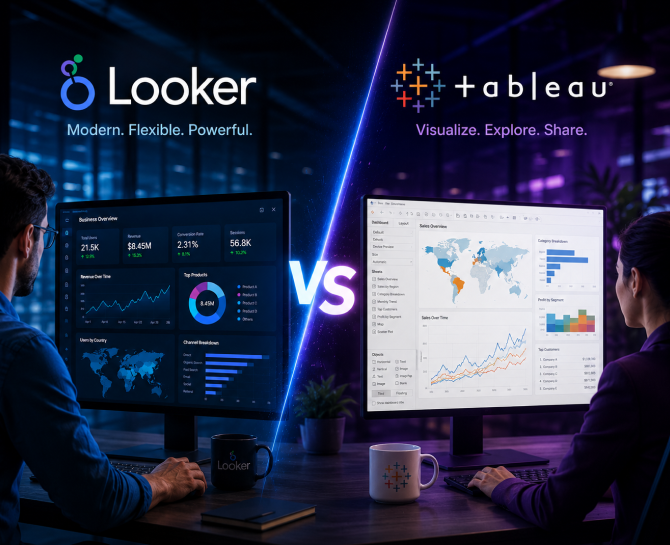
Looker vs Tableau: Choosing the Right Lens for Your Data
Looker wins when consistency is everything. Tableau wins when exploration is everything. The real question is: what does your team actually need to do with data every day?
Every few months, a data or marketing leader lands in the same exhausting meeting. Someone pulls up a revenue number. Someone else pulls up a different one. Both are technically correct. Both came from the same underlying data. And now 45 minutes of the week are gone trying to figure out which number to trust.
That meeting is not a people problem. It is a tool selection problem, and more often than not, it traces back to a moment when the business picked a BI platform for the wrong reasons: a slick demo, a friend’s recommendation, or a pricing deal that seemed too good to pass up.
Looker and Tableau are two of the most capable BI platforms on the market right now. But they are built on completely different philosophies, serve completely different team structures, and fail in completely different ways when mismatched. Choosing between them is not about picking the one with more features. It is about understanding which one fits the way your team actually thinks about data.
This guide cuts through the marketing language. No feature-by-feature tables. No vague “it depends” hedging. Just an honest breakdown of what each platform does well, where each one quietly struggles, and a clear decision framework so you can make the call with confidence.
Key Takeaways
- Tableau excels at visual storytelling with drag-and-drop dashboards; Looker enforces a single source of truth through LookML.
- Tableau is dramatically more affordable: roughly $150 to $250 per user per year versus Looker’s $150 to $200 per user per month.
- Looker is built for Google Cloud and data-mature teams comfortable with SQL; Tableau suits any analyst who needs fast, flexible insights.
- Neither tool delivers full value without clean, unified data underneath. Your data layer is the real foundation.
- DiGGrowth acts as the engine that feeds both platforms with governed, ready-to-use data.
Why Choosing the Wrong BI Tool Costs More Than You Think
Here is a scenario most marketing and data leaders recognize. Your team spends a week building a beautiful Tableau dashboard. Three days later, the Sales VP opens the same data in a different workbook and gets a different Revenue number. Cue the 90-minute reconciliation meeting that never fully resolves.
This is not a Tableau problem. It is a data governance problem, and it is exactly the kind of friction that the Looker vs Tableau debate forces you to confront. The right BI tool depends less on features and more on how your team is structured, how mature your data is, and what kind of decisions you are trying to speed up.
In 2026, both platforms will have added significant AI capabilities. But the underlying philosophy gap between them has not closed. Here is an honest breakdown.
Tableau: The Analyst’s Studio
Tableau has been the gold standard for visual analytics for over a decade, and it has earned that reputation. Its drag-and-drop interface lets analysts build complex, pixel-perfect dashboards without writing a line of code. If your goal is to explore data freely, find unexpected patterns, or produce executive-ready presentations, Tableau is genuinely hard to beat.
What makes it compelling: Tableau’s visualization library covers Sankey diagrams, heat maps, animated time series, and geographic overlays. The Tableau Exchange offers over 1,000 extensions and connectors. Tableau Pulse, introduced broadly in 2024, sends personalized metric alerts proactively so business users do not have to remember to check dashboards.
Where it struggles: Without a strong governance layer, Tableau deployments develop what analysts call metric sprawl. Over time, Revenue can mean twelve different things across twelve different workbooks. For fast-moving marketing teams, this is a silent budget killer.
Pricing: Tableau Creator costs approximately $75 per user per month. For a 50-user organization, expect roughly $25,000 to $40,000 per year in licensing alone, before training and implementation.
Looker: The Data Engineer’s Rulebook
Looker, part of Google Cloud since 2019, takes a fundamentally different approach. Instead of letting every analyst build their own version of the truth, Looker enforces it through LookML, a code-based modeling layer where metrics, dimensions, and joins are defined once and reused across every dashboard, every report, and every API call.
When your Head of Finance opens Monthly Recurring Revenue in Looker, they see the same number your CMO sees. No reconciliation meetings. No trust issues. That single-source-of-truth capability is why data-mature enterprises with multiple teams querying the same datasets tend to gravitate toward Looker.
What makes it compelling: Governance at scale. Version control via GitHub. Deep, native BigQuery integration for GCP users. API-first architecture for embedding analytics in SaaS products. Looker consistently delivers faster reporting cycles for teams that invest in LookML upfront.
Where it struggles: The LookML learning curve is real. Non-technical users cannot self-serve without data team support. Out-of-the-box visualizations are functional but lack Tableau’s visual richness. Since Google’s acquisition, some observers note that the core BI product roadmap has slowed.
Pricing: Looker is enterprise-quoted with no public self-serve tier. For a 50-user team, expect $36,000 to $60,000 per year, typically 6 to 12 times Tableau’s per-user cost.
How to Actually Decide: A Decision Matrix
Stop comparing feature lists. Ask these questions instead:
- Does your team have SQL engineers who can own a semantic layer? If not, Looker will frustrate everyone.
- Is one version of the truth a board-level priority? If yes, Looker’s governance model pays for itself.
- Are you on Google Cloud or planning to migrate to GCP? Looker’s BigQuery integration is genuinely best-in-class.
- Do your analysts need to explore data freely without waiting for a data model to be updated? Tableau wins on agility.
- Are you primarily a Salesforce shop? Tableau’s Einstein 1 integration creates data flows that Looker cannot replicate natively.
The Hidden Variable: Your Data Layer
Here is the truth neither vendor will tell you: the output quality of both Tableau and Looker is a direct reflection of the data flowing into them. Clean data produces clean insights. Messy data just produces prettier lies.
This is where DiGGrowth comes in. Before you invest in either platform, DiGGrowth builds the Unified Data Layer that makes both tools work as advertised, with standardized field names, consistent metric definitions, and clean unified profiles. Think of it as laying the foundation before choosing the paint color.
Ready to get started?
Increase your marketing ROI by 30% with custom dashboards & reports that present a clear picture of marketing effectiveness
Start Free Trial
Experience Premium Marketing Analytics At Budget-Friendly Pricing.

Learn how you can accurately measure return on marketing investment.

How Predictive AI Will Transform Paid Media Strategy in 2026
Paid media isn’t a channel game anymore, it’s a chessboard. Search, social, programmatic, video, influencer, native,...
Read full post post
Don’t Let AI Break Your Brand: What Every CMO Should Know
AI isn’t just another marketing tool. It’s changing how we connect with customers, personalize content, and...
Read full post post
From Demos to Deployment: Why MCP Is the Foundation of Agentic AI
A quiet revolution is unfolding in AI. And it’s not happening inside research labs. For decades,...
Read full post postFAQ's
Neither is universally better. Looker is better for organizations that need governed, consistent metrics and have technical teams comfortable with LookML. Tableau is better for analyst-driven exploration and visual storytelling. The right answer depends on your data maturity and team structure.
Looker is primarily designed for mid-market to enterprise organizations. Its pricing and LookML complexity make it cost-prohibitive for most small businesses. Tableau or Power BI are more practical starting points.
Looker is developer-centric with a code-based semantic layer (LookML) that enforces consistent metrics. Tableau is analyst-centric with a drag-and-drop interface optimized for visual exploration. Looker governs; Tableau explores.
Yes, absolutely. Both platforms amplify whatever data quality exists underneath them. Poor data standardization will produce inconsistent dashboards regardless of the platform. Establishing a unified data layer first is the most important step.