
Introduction to Marketing Analytics: Turning Data into Competitive Advantage
Marketing analytics bridges the gap between data and decision-making. This comprehensive guide explores segmentation, KPIs, predictive modeling, and top tools like DiGGrowth and Google Analytics 4. Learn how to convert raw performance data into actionable insights that power smarter campaigns, stronger ROI, and scalable growth.
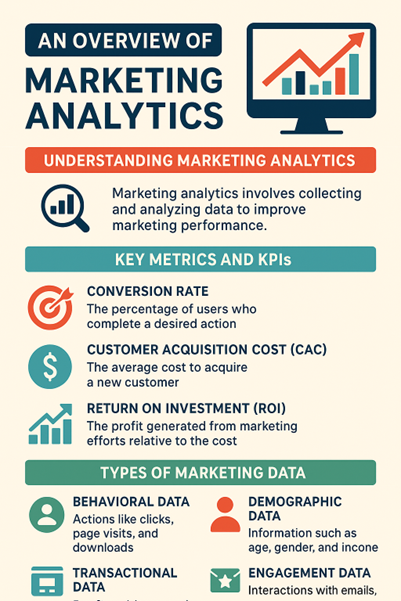
Marketing analytics refers to the practice of measuring, managing, and analyzing marketing performance to maximize effectiveness and optimize return on investment. In an environment saturated with digital campaigns, social media activity, and customer touchpoints, data alone doesn’t drive results-interpreting that data does.
Through structured analysis, marketing analytics converts raw data from platforms like Google Analytics, social ad managers, CRM systems, and email tools into clear, actionable insights. This process reveals patterns and consumer behaviors that inform successful campaign strategies, precise targeting, and efficient budgeting.
By quantifying performance, marketers can eliminate guesswork. They track what works, iterate quickly, and invest with confidence. This results in smarter decisions and measurable impact across the funnel, from lead generation to customer retention.
This guide breaks down the foundation of marketing analytics, covering core topics such as segmentation strategies, performance KPIs, attribution models, customer lifetime value, and more-equipping you to convert data into a growth engine.
Key Takeaways
- Data alone holds little value until interpreted through structured analysis. Marketing analytics converts fragmented metrics from CRMs, ad platforms, and automation tools into actionable insights that directly shape targeting, budgeting, and creative decisions.
- The era of instinct-driven marketing is over. Data-backed strategies enable real-time optimization, predictive forecasting, and smarter budget allocation, ensuring every marketing dollar contributes measurably to business growth.
- Platforms like DiGGrowth, Google Analytics 4, HubSpot, and Tableau unify multi-channel data into cohesive dashboards. This integration transforms raw performance data into a single source of truth for campaign health, ROI, and attribution analysis.
- When embedded across the marketing lifecycle, from segmentation to attribution, analytics becomes more than reporting; it’s the blueprint for scalable, evidence-based growth. Marketers who operationalize data-driven systems consistently outperform competitors who rely on assumptions.
Demystifying Marketing Analytics: The Backbone of Data-Driven Strategy
Understanding the Core of Marketing Analytics
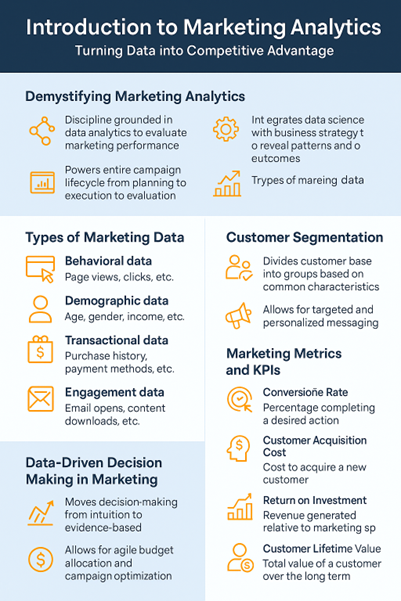
Marketing analytics is a discipline grounded in data analytics, used to evaluate and improve marketing performance. It examines massive volumes of structured and unstructured data to deliver insights that directly shape marketing strategy. The process involves collecting, analyzing, and interpreting data from multiple channels to inform both real-time decisions and long-term planning.
Its scope goes beyond simple reporting functions. Marketing analytics integrates data science with business strategy to reveal patterns, test hypotheses, and quantify outcomes. Analysts employ statistical modeling, data mining, and machine learning to transform raw marketing data into tactical and strategic guidance.
Fueling Campaigns From Start to Finish
Marketing analytics powers the entire campaign lifecycle-from initial planning through execution to post-campaign evaluation. During planning, data insights identify optimal audience segments, effective messaging strategies, and forecasted ROI. Throughout execution, near-real-time performance dashboards allow agile adjustments. After completion, detailed attribution and lift analyses isolate campaign impact, guiding future initiatives.
This end-to-end integration ensures campaigns are not merely creative exercises but quantifiable business investments. Brands that operationalize analytics into each campaign stage close the gap between strategy and execution.
Measuring What Matters: From Tactics to Strategy
Analytics makes it possible to measure a campaign’s tactical effectiveness and its broader strategic impact. By quantifying results, conversion rates, engagement depth, and channel-specific contribution to revenue, marketers shift from intuition-based to evidence-based decisions.
Strategically, marketing analytics identifies long-term trends and shifts in consumer behavior. With this foresight, organizations can prioritize high-performing channels, allocate budgets with precision, and forecast market movement. The result is marketing that not only delivers on KPIs but aligns tightly with business objectives.
Types of Marketing Data That Drive Analytics
- Behavioral data: This includes customer actions such as page visits, clicks, and browsing patterns. It reveals intent and interest in near real-time.
- Demographic data: Age, gender, income level, occupation, and education level provide insight into who the customer is.
- Transactional data: Purchase history, frequency, cart size, and payment methods build a profile of spending behavior and product preferences.
- Engagement data: Email opens, social shares, mobile app usage, and content downloads highlight how and when audiences interact with brand assets.
Analyzing these data types in concert delivers a holistic view of the customer journey across channels. Instead of isolated metrics, marketers gain complete customer narratives that enhance targeting, messaging, and offer timing.
Customer Segmentation: Understanding Your Audience
Defining Customer Segmentation and Its Role in Targeted Messaging
Customer segmentation breaks down a diverse customer base into smaller, more manageable groups. Each segment shares common characteristics-whether demographic, behavioral, psychographic, or geographic-that make tailored messaging possible. Rather than distribute generic campaigns to a broad audience, segmentation allows marketers to focus communication on what actually motivates distinct customer groups.
Retailers launching a new product can focus their efforts on high-propensity buyers defined by past purchase behavior. B2B marketers can prioritize high-value leads based on firm size, industry, or prior engagement patterns. Segmentation puts precision into audience targeting, making every marketing dollar work harder.
Personalizing Campaigns Through Segment Analysis
By analyzing the unique attributes of each customer segment, marketing teams gain insight into what resonates with different audiences. Age range, spending habits, digital engagement channels-they all affect how people respond. Segmentation leads directly to personalization, and personalized campaigns consistently outperform broad-based efforts.
Email open rates jump. Click-through rates improve. Conversion rates increase. According to a 2023 HubSpot study, personalized email subject lines deliver 50% higher open rates compared to non-segmented campaigns. And customer journey mapping for individual segments makes it possible to synchronize messaging across channels for a cohesive experience.
Key Metrics for Segment Definition: RFM Analysis
Segmentation often employs quantitative frameworks. One of the most widely used models is the RFM model, Recency, Frequency, and Monetary Value.
- Recency (R): Measures how recently a customer made a purchase. Customers who have bought recently are more likely to return.
- Frequency (F): Measures the frequency of customer purchases over a specified time period. Repeat buyers indicate strong engagement.
- Monetary Value (M): Tracks how much a customer spends. High spenders represent the most valuable segments.
Marketers use RFM scoring to assign scores to each customer, typically on a scale from 1 to 5, for each of the three metrics. A customer with a score of R=5, F=5, M=5 represents the ideal: recent, frequent, high-value. These customers should receive exclusive retention campaigns, VIP offers, and early-access perks.
Meanwhile, infrequent or low-value shoppers might be retargeted with reactivation emails or exit surveys. Using RFM, segmentation becomes a data-backed process, not guesswork.
Pro Tip : Combine RFM scores with behavioral and demographic data to create even sharper customer segments. For instance, pairing high-frequency buyers (F=5) with specific age groups or preferred channels can reveal micro-segments that respond best to personalized offers, boosting both engagement and ROI.
Marketing Metrics and KPIs: Measuring Performance
Metrics vs. KPIs: Breaking Down the Difference
Metrics track specific aspects of a marketing activity. They report on what happened: engagements, impressions, and click-through rates. By contrast, Key Performance Indicators (KPIs) measure progress toward strategic business goals. Every KPI is a metric, but not every metric is a KPI.
A SaaS company might monitor dozens of metrics, email open rates, blog visits, and webinar sign-ups, but focus on just a few KPIs, like Monthly Recurring Revenue (MRR) or Customer Acquisition Cost (CAC). The distinction lies in purpose: KPIs guide executive decisions, metrics provide context and operational insight.
Key Marketing KPIs That Drive Strategy
- Conversion Rate: This KPI calculates the percentage of users who complete a desired action, such as purchasing a product or signing up for a trial. For example, if 2,000 visitors land on a product page and 120 make a purchase, the conversion rate is 6%. High-converting channels warrant increased investment; underperforming ones require investigation.
- Customer Acquisition Cost (CAC): CAC quantifies how much it costs, on average, to acquire one customer. It includes spending on ads, salaries, tech, and overhead. Divide total acquisition expenses in a given period by the number of customers acquired. A sharp rise in CAC may signal inefficiencies – or a shift in competitive dynamics.
- Return on Investment (ROI): ROI measures the financial return on marketing efforts. The formula: (Revenue from marketing – Marketing cost) / Marketing cost. If a campaign generated $200,000 in revenue from $50,000 spent, the ROI = 3.0 or 300%. This ratio gives leadership the clearest metric for budget justification.
Strategy Begins with KPI Alignment
Aligning KPIs with business objectives eliminates guesswork and focuses teams on what matters. For an e-commerce company prioritizing profitability, ROAS (Return on Ad Spend) and Average Order Value make more sense than social media reach. If the company’s goal is rapid growth, CAC and Customer Lifetime Value (CLV) will take center stage.
Enterprise-level alignment transforms KPIs into levers for competitive advantage. Marketing leaders identify which KPIs reflect progress toward the CEO’s agenda – whether it’s expanding into new markets, increasing retention, or driving shareholder value. Reports generated from this alignment don’t just inform; they influence high-stakes decisions.
Pro Tip : Don’t track everything, track what matters. Identify three to five KPIs that directly align with your business goals, and assign ownership to specific team members. This focused approach prevents dashboard overload, ensures accountability, and keeps performance reporting tied to measurable business outcomes rather than vanity metrics.
Data-Driven Decision Making in Marketing
The End of Intuition-Only Marketing
Marketers once relied heavily on instinct and anecdotal evidence to shape their strategies. That era is over. Access to granular data from every customer touchpoint has transformed how decisions get made-from guesswork to precision. Today, top-performing companies shift budgets, adjust creatives, and optimize targeting based on data insights, not hunches.
This transformation aligns with Gartner’s 2023 report, which found that 76% of CMOs are now prioritizing data insights over intuition when making marketing budget decisions. The shift isn’t theoretical-it’s happening in boardrooms every quarter.
The Payoff: Smarter, Faster, and More Confident Decisions
Data analytics unlocks faster and more accurate responses to market changes. Instead of waiting until the end of a campaign cycle to assess results, marketers now monitor performance metrics in real time and act decisively.
- Agile budget allocation: Marketing teams redistribute spending across channels daily or weekly, backed by ROI metrics, not assumptions.
- Campaign optimization in hours, not weeks: Underperforming creatives get paused quickly, while top performers receive extended support and resources.
- Tighter alignment with business goals: Marketers align spend with KPIs such as customer acquisition cost (CAC) and revenue per user, maintaining transparency with executive leadership.
Consider a digital brand running multi-platform ads. If Facebook CPMs suddenly spike while conversion rates fall, a data-driven dashboard flags the inefficiency. Within hours, the team shifts the budget to Google Search, where the cost per acquisition holds steady. That same data culture enables the same brand to pause a promotional email campaign mid-flight when open and click-through rates fall below benchmarks, cutting losses instantly.
Data as the Central Nervous System of Marketing Strategy
Decisions that once required layers of approval and weeks of analysis now happen instantly through automation and predictive modeling. When teams embrace a data-first approach, they gain a real-time intelligence system that flags both threats and opportunities before competitors respond.
Driven by tools like Google Analytics 4, Tableau, and marketing data management platforms, brands not only monitor but also self-optimize. Nike, for instance, has centralized its data streams to align regional marketing efforts with global sales trends, reacting faster and with more surgical precision than any manual process could allow.
Pro Tip : Build a single source of truth for your marketing data. When all teams, from creative to finance, access unified dashboards, decisions become faster, alignment strengthens, and performance insights stay consistent. Fragmented data leads to conflicting conclusions; integrated data builds confident, evidence-based action. .
Predictive Analytics: Forecasting Future Marketing Outcomes
Defining Predictive Analytics and Its Role in Marketing
Predictive analytics uses statistical techniques, machine learning algorithms, and historical data to anticipate future marketing outcomes. By recognizing patterns in past behavior, teams can identify which touchpoints drive conversions, forecast campaign performance, and focus investment where ROI is highest.
The approach shifts marketers from reactive planning to proactive strategy. Rather than asking what happened, predictive models answer what will happen next-and why.
Common Use Cases in Marketing
- Customer churn prediction: Logistic regression, decision trees, and support vector machines analyze user behavior across platforms to flag signals of disengagement. For instance, a subscription service can anticipate cancellations based on declining login frequency or decreased usage of features.
- Customer Lifetime Value (CLV) Estimation: Predictive CLV modeling utilizes transactional data, engagement frequency, and demographic attributes to predict expected revenue over a customer’s lifespan. Recency-frequency-monetary (RFM) modeling plays a foundational role here, enhanced with AI for real-time recalculation.
- Campaign success forecasting: Predictive models evaluate historical performance by channel, audience, and timing to forecast the probable outcome of future campaigns. Multivariate regression, uplift modeling, and neural networks often power these forecasts.
Tools and Models Used in Enterprise Environments
Leading firms rely on scalable platforms and advanced models to operationalize predictive analytics. These systems support real-time data ingestion, automate model training, and seamlessly integrate with CRM or marketing automation tools.
- SAS Predictive Analytics: Widely adopted in finance and retail, SAS enables deep data mining, segmentation, and forecasting with built-in decision tree and neural network capabilities.
- Google Cloud Vertex AI and BigQuery ML: Marketers utilize these platforms to build and deploy machine learning models directly from structured customer data, eliminating the need to export datasets or manage infrastructure.
- Python-based frameworks: Libraries like Scikit-learn, XGBoost, and Prophet (developed by Meta) support custom pipeline development for time series forecasting, classification, or clustering, giving teams control over every modeling step.
Forecasting isn’t about guessing. It’s about leveraging probabilities, built from patterns, governed by data. Marketers using predictive analytics set strategic direction with precision, not intuition.
Pro Tip- Start small with predictive analytics. You don’t need complex neural networks right away, begin by identifying one or two key problems, such as churn prediction or lead scoring, and build simple regression or decision tree models around them. Early wins build confidence, demonstrate ROI, and lay the groundwork for more advanced AI-driven forecasting later.
A/B Testing: Optimizing Campaigns Through Experimentation
What Is A/B Testing and Where It Fits in Marketing Analytics
A/B testing, also known as split testing, is a controlled experiment comparing two or more variants of a marketing element to determine which performs better. It sits at the core of performance optimization within the broader practice of marketing analytics. Marketers apply A/B testing to digital ads, email campaigns, landing pages, headlines, calls-to-action, and virtually any user-facing asset.
Within marketing analytics, A/B testing provides statistically grounded insights by isolating variables and measuring changes in outcomes. Unlike assumptions or opinion-based decisions, it leverages empirical data to reveal what resonates with audiences. This method enables incremental gains, refined targeting, and scalable improvements that compound over time.
Steps to Run a Successful A/B Test
1. Formulate a Hypothesis: Define a clear, testable statement predicting how a change will impact results. For instance, “Changing the call-to-action button color from blue to orange will increase CTR by 10%.”
2. Select Relevant Metrics: Match the success indicators to the test objective. Use click-through rate (CTR), conversion rate, bounce rate, time on site, or revenue per visitor, depending on the context.
3. Segment and Randomize: Randomly assign users to control and variation groups to eliminate selection bias. Ensure a statistically significant sample size, based on historical data, to validate the findings.
4. Implement and Launch: Run the test concurrently for all variants under the same conditions. Maintain integrity by keeping external factors constant.
5. Analyze the Results: Apply statistical analysis such as confidence intervals or p-values to validate whether observed differences are meaningful. If a variant consistently outperforms the control, adopt it.
How A/B Testing Improves Strategic Decision-Making in Creative and Message Selection
Quantitative evaluation through A/B testing removes ambiguity from creative decision-making. Marketers use it to identify which images, copy, subject lines, or layouts deliver stronger engagement. When running multi-variant campaigns, A/B tests clarify which storytelling elements drive conversions and which fall flat.
This approach enables iterative refinement. Instead of launching complete overhauls, teams test micro-changes, wording shifts, layout tweaks, or offer variations, and scale what works. Over time, it transforms subjective discussions about design or messaging into measurable, evidence-driven choices that enhance ROI.
Pro Tip : Always test one variable at a time. Changing multiple elements, like copy, layout, and color simultaneously, makes it impossible to isolate what caused the improvement. Keep tests simple, ensure sample sizes are statistically valid, and document every result. Consistent A/B testing builds a library of proven insights that sharpen every future campaign.
Campaign Performance Analysis: Learning from Data
Interpreting the Completion and Success of Campaigns
Every campaign tells its own story. Once the scheduled timeline ends, the evaluation begins-not just to confirm delivery, but to decode impact. Completion metrics include delivery rate, total impressions, ad spend versus budget, and adherence to the timeline. However, campaign success extends beyond executional closure.
Marketers must compare final results against clearly defined objectives. If the goal is lead generation, measurement focuses on cost-per-lead (CPL), the volume of qualified leads, and the lead-to-customer conversion rate. For e-commerce objectives, return on ad spend (ROAS), average order value (AOV), and revenue growth are key metrics. Success doesn’t live in a single number; it emerges from a pattern across multiple data points aligned with strategic goals.
Key Metrics That Reveal Campaign Health
- Click-Through Rate (CTR): This ratio of clicks to impressions uncovers how compelling the ad creative and offer are to the target audience. A decline in CTR may signal a dissonance between the message and the intent.
- Conversion Rate: Calculated as the percentage of users who took the intended action post-click, this metric isolates the effectiveness of landing pages and user flows.
- Cost per Acquisition (CPA): By dividing total campaign spend by the number of conversions, CPA exposes the financial efficiency of a campaign.
- Return on Ad Spend (ROAS): This revenue-to-spend ratio helps distinguish profitable campaigns from those that drive losses. A ROAS of 3:1 means every $1 spent returns $3 in revenue.
- Customer Engagement: Metrics such as bounce rate, average session duration, and scroll depth track how users behave after reaching a digital destination.
Monitor these metrics not just in isolation but across time intervals, customer segments, and geographic overlays to detect meaningful patterns and deviations.
Tools and Dashboards that Support Insight Discovery
Effective campaign analysis begins with the right instrumentation. Standard platforms provide multi-dimensional access to performance data:
- DiGGrowth: A comprehensive marketing analytics and attribution platform that unifies data from CRM, ad networks, and automation tools. DiGGrowth surfaces multi-touch attribution insights, pipeline contribution metrics, and ROI trends across channels, enabling revenue-driven decision-making with minimal manual effort.
- Google Analytics 4: Tracks user behavior, event completions, and e-commerce funnel performance across web and app environments with real-time reporting features.
- Meta Ads Manager: Provides granular insights into audience targeting effectiveness, creative performance, and cost-efficiency metrics for Facebook and Instagram campaigns.
- Looker Studio (formerly Google Data Studio): Transforms multiple data sources into customizable dashboards, enabling cross-platform campaign visualization.
- HubSpot Marketing Hub: Integrates campaign reporting across email, social, and paid media, linking lead-gen metrics directly to the CRM pipeline.
- Tableau: Empowers deeper statistical analysis and trend identification with advanced data modeling across large-scale datasets.
By integrating these tools with marketing automation platforms and CRM systems, campaign insights become actionable intelligence. Patterns emerge. Underperforming stages are isolated. Budget allocations are recalibrated. Strategy evolves, not from assumption, but from evidence.
Marketing Data Sources and Collection
Where Marketing Data Comes From
Marketing analytics begins with sourcing robust and reliable data, which requires tapping into a broad ecosystem of platforms. Each touchpoint with a potential or existing customer contributes signals that, when aggregated, can unlock meaningful insights.
- Customer Relationship Management (CRM) systems: These databases centralize customer interactions, purchase histories, and service touchpoints, providing a comprehensive view of customer relationships. Platforms like Salesforce, HubSpot, and Zoho capture granular details on lead progression, sales funnel velocity, and customer retention patterns.
- Web analytics tools, such as Google Analytics, Adobe Analytics, DiGGrowth, and Mixpanel, track user behavior across digital properties. Metrics such as session duration, bounce rate, exit pages, and conversion pathways provide a behavioral map of how visitors engage with a brand’s online presence.
- Advertising platforms: Google Ads, Facebook Ads Manager, LinkedIn Campaign Manager, and programmatic DSPs generate real-time data on impressions, clicks, cost-per-conversion, and return on ad spend (ROAS). Integrating these with CRM data links ad spend directly to business results.
- Email marketing platforms: Systems like Mailchimp, Klaviyo, and ActiveCampaign track open rates, click-through rates, unsubscribe patterns, and automation workflows. These metrics illuminate how audiences interact with content over time.
Integrating Disparate Data Streams
Aggregating data from siloed systems increases visibility across the funnel, but only when executed with precision. Systems like customer data platforms (CDPs) and data lakes facilitate cross-source integration, enabling marketers to unify identifiers such as email addresses, device IDs, or session tokens and build a coherent user profile.
Data deduplication, standardization of naming conventions, and resolution of conflicting entries are non-negotiables in the merging process. Incomplete or inconsistent data leads to skewed attribution and flawed insights.
Why Data Quality Always Wins
Analytical output mirrors the integrity of its input. Missing values, duplicate records, incorrect formatting, and timestamp mismatch all degrade the usability of data frameworks. Implement field validation, enforce consistent data schemas, and automate anomaly detection to maintain high fidelity across records. Without these controls, forecasting and attribution quickly unravel.
Ethical Data Collection and Regulatory Compliance
Compliance with privacy regulations shapes how marketers structure their data collection architecture. The General Data Protection Regulation (GDPR) in the EU and the California Consumer Privacy Act (CCPA) in the US establish strict boundaries regarding consent, access, and the use of personal data.
Consent management platforms (CMPs), clear opt-in mechanisms, and data minimization principles reduce legal risk while maintaining user trust. Marketers who embed compliance into data architecture, rather than retrofitting it, retain agility as legislation evolves.
Translating Analytics Into Strategic Marketing Foundations
Marketing analytics isn’t just a reporting function-it’s the operating system for high-performance marketing organizations. Every metric analyzed, every segment profiled, every attribution model applied becomes a foundational element of strategic execution.
Data-Led Strategy Beats Guesswork Every Time
When decisions rely solely on instinct or anecdotal experience, campaign risk increases and ROI shrinks. Marketing analytics flips that model by enabling precision: campaigns calibrate to audience behavior, channels realign toward proven performance patterns, and content evolves based on measurable results.
Executives want results. They need to understand what’s working, what’s wasting budget, and where to scale. Marketing analytics answers all three, not with opinions, but with statistically validated evidence drawn from performance data.
ROI Grows When You Track What Actually Matters
Piling up metrics won’t improve performance-only the right indicators will. Sophisticated analytics programs prioritize:
- Customer Acquisition Cost (CAC) and Customer Lifetime Value (CLV) to quantify profitability at scale
- Multi-touch attribution to surface high-value conversions previously hidden in cross-channel funnels
- Segmentation analysis to funnel resources toward high-yield personas and cut waste on unresponsive audiences
- Marketing mix modeling to identify optimal resource allocations across paid, owned, and earned media
Analysis centered on these metrics yields significant improvements in margin and retention rates across various industries, including SaaS and retail.
Design for Scale: Let Analytics Lead Growth Architecture
For enterprise teams, analytics becomes more than a performance-measurement layer-it serves as the blueprint for expanding markets, reallocating spend dynamically, and deploying channel or audience-specific creative strategies. Marketing architecture built on impressions and opens won’t scale profitably. A system designed around cohort behaviors, ROI-focused signals, and iterative testing will.
Think of analytics as both the microscope and the map. It reveals what’s happening at the campaign level and guides broader strategic trajectories. By embedding analytics, from audience segmentation to attribution modeling, into day-to-day operations, marketing evolves from a cost center to a revenue engine.
Transform Your Marketing Data into Measurable Growth. Schedule a Demo with DiGGrowth Today. Drop us a line at info@diggrowth.com to get started.
Ready to get started?
Increase your marketing ROI by 30% with custom dashboards & reports that present a clear picture of marketing effectiveness
Start Free Trial
Experience Premium Marketing Analytics At Budget-Friendly Pricing.

Learn how you can accurately measure return on marketing investment.

How Predictive AI Will Transform Paid Media Strategy in 2026
Paid media isn’t a channel game anymore, it’s a chessboard. Search, social, programmatic, video, influencer, native,...
Read full post post
Don’t Let AI Break Your Brand: What Every CMO Should Know
AI isn’t just another marketing tool. It’s changing how we connect with customers, personalize content, and...
Read full post post
From Demos to Deployment: Why MCP Is the Foundation of Agentic AI
A quiet revolution is unfolding in AI. And it’s not happening inside research labs. For decades,...
Read full post postFAQ's
Marketing analytics is the process of measuring, managing, and analyzing marketing performance to maximize effectiveness and ROI. It helps marketers move beyond assumptions by turning raw data into actionable insights. With analytics, teams can identify what drives engagement, optimize spending, and align campaigns directly with business objectives.
By continuously tracking metrics like conversion rates, CAC, and ROAS, marketing analytics reveals which channels, creatives, and audience segments perform best. Real-time dashboards and predictive models enable marketers to reallocate budgets, test new strategies, and refine targeting, all of which boost campaign efficiency and profitability.
Modern marketing teams rely on integrated platforms such as DiGGrowth, Google Analytics 4, HubSpot, Tableau, and Looker Studio. These tools centralize cross-channel data, visualize performance trends, and deliver actionable insights. When connected with CRM and automation systems, they provide a single view of the customer journey from awareness to conversion.
Predictive analytics uses machine learning and historical data to forecast future outcomes, such as conversion likelihood, customer churn, or campaign success. By anticipating behavior and market shifts, marketers can proactively adjust strategies, focus on high-value segments, and improve long-term ROI instead of reacting after results are in.
The first step is to centralize data from all marketing channels, CRM, ads, web analytics, and automation tools, into a unified system. From there, define clear KPIs aligned with business goals and build dashboards that track them consistently. Start small with A/B testing and segmentation, then scale toward predictive and multi-touch attribution models as data maturity grows.