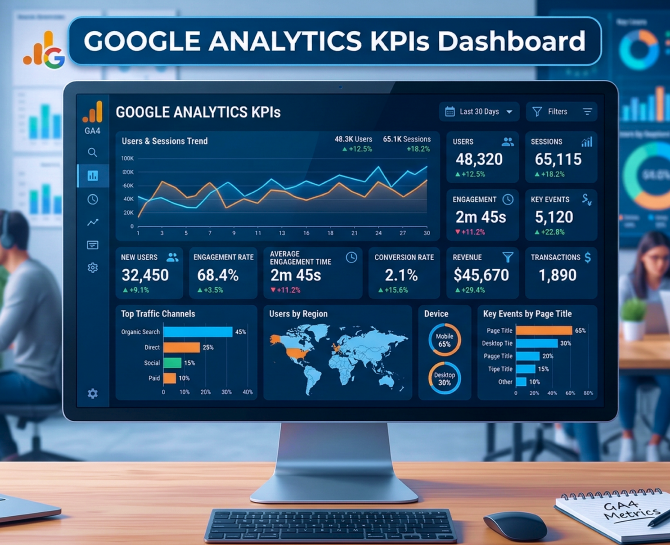
Google Analytics KPIs Checklist for Marketing and Growth Teams to Improve ROI in 2026
Google Analytics KPIs define how teams measure growth and ROI. This blog covers a practical checklist across acquisition, engagement, conversion, and retention to help teams focus on metrics that drive real business impact.
Most marketing teams today are tracking more data than ever, yet proving ROI still feels unclear.
Reports are filled with metrics, dashboards look complete, but when it comes to answering simple questions like what is driving revenue or where to invest next, the answers are often scattered. This gap usually comes from tracking too many numbers without focusing on the Google Analytics KPIs that actually impact business outcomes.
In 2026, the focus is shifting from volume to relevance. Marketing and growth teams are expected to rely on Google Analytics KPIs that connect user behavior, conversions, and revenue into a clear performance story.
This blog brings you a focused Google Analytics KPIs checklist built to help you cut through the noise, track what truly matters, and make decisions that consistently improve ROI.
Key Takeaways
- Tracking the right Google Analytics KPIs is more important than tracking more data.
- High-impact KPIs directly connect user behavior with revenue and ROI.
- Strong acquisition and engagement metrics only matter when they lead to conversions.
- Retention and customer value play a critical role in long-term growth.
- Consistent analysis and optimization turn KPI insights into measurable business outcomes.
What Makes A Good Google Analytics KPI In 2026
Not every metric in Google Analytics deserves your attention. The real value comes from identifying Google Analytics KPIs that directly influence decisions and outcomes.
A strong Google Analytics KPI starts with clear alignment to business goals. Whether the objective is increasing revenue, improving lead quality, or reducing acquisition costs, every KPI should tie back to a measurable impact on ROI.
Relevance is equally important. In 2026, teams are moving away from vanity metrics like page views in isolation and focusing more on indicators that reflect user intent, engagement quality, and conversion potential.
Actionability is what separates useful data from noise. The best Google Analytics KPIs highlight where performance is strong, where it is dropping, and what actions need to be taken next. If a metric does not guide a decision, it is not worth prioritizing.
Finally, a good Google Analytics KPI should be easy to track consistently across channels and campaigns. This ensures that marketing and growth teams can compare performance, identify patterns, and optimize strategies without confusion.
Google Analytics KPIs Checklist for Marketing and Growth Teams
1. Acquisition KPIs
Acquisition KPIs determine whether your marketing efforts are bringing in the right audience, not just more traffic. In 2026, success is defined by how efficiently you attract users who engage, convert, and contribute to revenue. The focus is on connecting acquisition data directly to ROI, not just visibility.
Track Users And New Users
- Measure total users to understand the true reach of your campaigns across channels.
- Track new users to evaluate how effectively your strategies are expanding your potential customer base.
- Compare new vs returning users to identify gaps between acquisition and retention efforts.
- Analyze user trends over time to spot consistent growth, campaign impact, or sudden drop-offs.
This KPI helps teams move beyond surface-level traffic and assess whether growth is sustainable or driven by short-term spikes.
Analyze Traffic Sources And Channel Performance
- Break down traffic by channel to understand where your highest-value users originate.
- Evaluate engagement and conversion rates for each channel instead of relying only on traffic volume.
- Identify which channels bring high-intent users who are more likely to convert.
- Assess multi-channel contribution to understand how different sources influence the customer journey.
This approach ensures that budget allocation is driven by performance and impact, not assumptions about channel effectiveness.
Measure Cost Per Acquisition Across Channels
- Calculate cost per acquisition to determine how much you spend to gain each customer or lead.
- Compare CPA across channels to identify the most efficient and scalable acquisition sources.
- Align CPA with revenue or customer lifetime value to ensure long-term profitability.
- Monitor CPA trends to quickly detect inefficiencies or rising acquisition costs.
Tracking cost per acquisition at a detailed level allows marketing and growth teams to scale what works, cut what does not, and continuously improve ROI through smarter investment decisions.
2. Engagement KPIs
Once users land on your website, the next question is whether they engage or leave without taking action. Engagement KPIs help you assess the quality of your traffic and how effectively your content and experience keep users interested.
In 2026, engagement is defined by meaningful interactions. It is not just about how long users stay, but what they actually do during their visit and how close they move toward conversion.
Monitor Engagement Rate And Average Engagement Time
Engagement rate shows the percentage of users who actively interact with your website, making it a strong indicator of traffic quality. Average engagement time adds context by revealing how long users stay involved with your content in a meaningful way. Together, these metrics help you identify whether your campaigns are attracting the right audience and whether your website experience is meeting expectations.
Track Pages Per Session And Key Interactions
Pages per session highlights how deeply users explore your website. A higher number often indicates stronger interest and better content flow. At the same time, tracking key interactions such as clicks, scroll behavior, video views, or downloads provides deeper insight into what users actually value. These signals help teams understand user intent and refine content, layout, and calls to action.
Identify High-Performing And Low-Performing Pages
Not all pages contribute equally to engagement. High-performing pages typically combine strong content, clear messaging, and effective user experience. On the other hand, pages with high traffic but low engagement often signal gaps in relevance or usability. Identifying and optimizing these pages can significantly improve overall performance and guide users more effectively toward conversion.
3. Conversion KPIs
Traffic and engagement only matter if they lead to action. Conversion KPIs help you understand how effectively your website turns visitors into leads, sign-ups, or customers. In 2026, the focus is on tracking conversions across the entire journey, not just the final step.
Measure Conversion Rate Across Channels
Analyzing this across different channels helps you identify which sources are driving real business outcomes, not just traffic. It also highlights gaps where users drop off despite strong acquisition or engagement.
Track Goal Completions And Key Events
Goal completions and key events represent the actions that matter most to your business, such as form submissions, purchases, or sign-ups. Tracking these consistently allows teams to measure performance against clear objectives and understand which user actions contribute most to growth.
Analyze Drop-Offs In Conversion Paths
Not every user completes the journey. Analyzing where users drop off in the conversion path helps identify friction points, whether it is a complex checkout process, unclear messaging, or poor user experience. Fixing these gaps can have a direct impact on improving conversion rates and overall ROI.
| KPI | What It Shows | Why It Matters |
|---|---|---|
| Conversion Rate | % of users completing actions | Measures efficiency of traffic |
| Goal Completions | Total key actions | Tracks business performance |
| Key Events | Important user interactions | Indicates intent before conversion |
| Conversion Paths | User journey to conversion | Shows how conversions happen |
| Drop-Off Points | Where users exit | Highlights friction areas |
4. Revenue KPIs
Conversions indicate actions, but revenue KPIs reveal whether those actions are actually driving business growth. These Google Analytics KPIs help marketing and growth teams connect performance to financial outcomes, ensuring that efforts are not just generating activity but delivering measurable ROI.
- Track Total Revenue And Transactions: Monitor total revenue alongside the number of transactions to understand both growth and sales volume. This helps identify whether increases in conversions are translating into higher revenue or if transaction value is declining. It also provides a clear view of overall business performance across time periods.
- Measure Average Order Value: Analyze the average value per transaction to understand how much each purchase contributes to revenue. A rising average order value often indicates effective pricing strategies, bundling, or upselling, while a decline may signal discount dependency or low-value conversions.
- Evaluate Revenue By Channel: Break down revenue across channels such as organic, paid, and referral to identify which sources deliver the highest financial return. This goes beyond traffic and conversion data, helping teams allocate budgets toward channels that generate the most revenue, not just visits.
- Analyze Revenue Per User: Measure how much revenue each user generates on average to assess traffic quality. This KPI helps compare audiences across channels and campaigns, revealing which segments are more valuable and worth scaling.
- Track Customer Lifetime Value: Estimate the total revenue a customer generates over their relationship with your business. This is essential for understanding long-term profitability and ensuring that acquisition costs remain sustainable in relation to customer value.
Pro Tip- By focusing on these Google Analytics KPIs, teams can shift from tracking short-term wins to building strategies that drive consistent and scalable revenue growth.
5. Retention KPIs
Retention KPIs help you understand whether users continue to engage with your business after their first interaction. In 2026, improving retention is critical for ROI because it increases the value of existing users and reduces reliance on continuous acquisition.
Monitor Returning Users And Retention Rate
- Measure returning users to evaluate how many visitors come back after their first session.
- Track retention rate over specific time periods such as 7, 14, or 30 days.
- Compare retention across channels to identify which sources bring more loyal users.
- Analyze trends to detect drops in retention that may indicate experience or relevance issues.
Together, these Google Analytics KPIs help assess whether your acquisition and engagement strategies are building sustained user interest.
Track Customer Lifetime Value
Customer lifetime value measures the total revenue a user generates throughout their relationship with your business. This KPI is essential for understanding long-term profitability and ensuring that your acquisition efforts remain cost-effective. A higher lifetime value often indicates strong retention, better user experience, and more effective targeting.
Analyze Repeat Purchase Or Revisit Behavior
Repeat purchases or revisits highlight how often users return to take meaningful actions. This behavior is a strong indicator of user satisfaction and loyalty. Analyzing these patterns helps identify what drives users to come back, allowing teams to refine strategies, improve engagement, and increase overall customer value.
How To Use This Google Analytics KPIs Checklist To Improve ROI
Tracking Google Analytics KPIs is only valuable when it leads to better decisions. Marketing and growth teams need to actively use these KPIs to guide strategy, optimize performance, and drive measurable outcomes.
Prioritize KPIs Based On Business Goals
The first step is to align your Google Analytics KPIs with clear business objectives such as revenue growth, lead generation, or cost efficiency. Instead of tracking every available metric, focus on the KPIs that directly impact these goals. This ensures that your analysis remains relevant and tied to outcomes that matter.
Create Dashboards For Real-Time Tracking
Centralizing your Google Analytics KPIs through dashboards allows teams to monitor performance without switching between multiple reports. Real-time visibility helps identify trends, spot sudden changes, and respond quickly to performance shifts, making your tracking more proactive than reactive.
Optimize Campaigns Based On KPI Insights
KPI data should directly inform campaign decisions. By analyzing performance across channels, campaigns, and audiences, teams can identify what is driving results and what is underperforming. This enables smarter budget allocation, improved targeting, and more effective messaging, all of which contribute to better ROI.
Continuously Test And Refine Strategies
Improving ROI is an ongoing process. Google Analytics KPIs should be used to test new ideas, measure their impact, and refine strategies over time. Whether it is optimizing landing pages, experimenting with new channels, or adjusting user journeys, continuous improvement ensures sustained growth and efficiency.
Conclusion
Google Analytics KPIs are not just metrics to report, they are decision-making tools that shape how marketing and growth teams operate. The difference between average performance and measurable ROI often comes down to how effectively these KPIs are selected, tracked, and acted upon.
When teams focus on the right signals, they gain clarity on what is driving results, where inefficiencies exist, and how to scale performance without unnecessary spend. This level of visibility makes it easier to align marketing efforts with business goals and move from reactive reporting to proactive growth strategies.
If your current reporting still feels scattered or does not clearly connect to ROI, it may be time to rethink how your KPIs are structured and used. A more focused, insight-driven approach can unlock better decisions and stronger outcomes across every channel.
Ready to turn your Google Analytics KPIs into a clear growth engine? Let’s Talk!
Reach out at info@diggrowth.com and start making your data work smarter.
Ready to get started?
Increase your marketing ROI by 30% with custom dashboards & reports that present a clear picture of marketing effectiveness
Start Free Trial
Experience Premium Marketing Analytics At Budget-Friendly Pricing.

Learn how you can accurately measure return on marketing investment.

You’re Targeting Your Ideal Customer. So Why Aren’t They Buying?
Your best customers reveal the traits associated with success. Your lost opportunities reveal where fit breaks...
Read full post post
How Predictive AI Will Transform Paid Media Strategy in 2026
Paid media isn’t a channel game anymore, it’s a chessboard. Search, social, programmatic, video, influencer, native,...
Read full post post
Don’t Let AI Break Your Brand: What Every CMO Should Know
AI isn’t just another marketing tool. It’s changing how we connect with customers, personalize content, and...
Read full post postFAQ's
Senior leaders should review Google Analytics KPIs at multiple levels. Weekly reviews help track campaign performance, while monthly or quarterly reviews provide deeper insights for budget allocation and long-term strategy. Consistent reviews ensure timely adjustments and better ROI outcomes.
Google Analytics KPIs can support revenue forecasting by linking conversion rates, average order value, and traffic trends with historical performance. When tracked consistently, these KPIs help create more accurate projections and reduce uncertainty in planning.
Standardization requires defining a core set of Google Analytics KPIs that align with business goals and ensuring all teams use the same definitions and tracking methods. This creates consistency in reporting, reduces confusion, and improves cross-functional decision-making.
Executives should focus on Google Analytics KPIs that directly connect to revenue, cost efficiency, and customer value. Metrics like conversion rate, cost per acquisition, and lifetime value provide clearer insights into ROI compared to surface-level engagement metrics.
As organizations scale, KPI tracking should evolve through better data integration, automated reporting, and advanced segmentation. This ensures that growing data complexity does not reduce clarity and that teams can continue making fast, informed decisions at scale.