SEO Dashboard in Google Data Studio: How to Build and Optimize for Actionable Insights
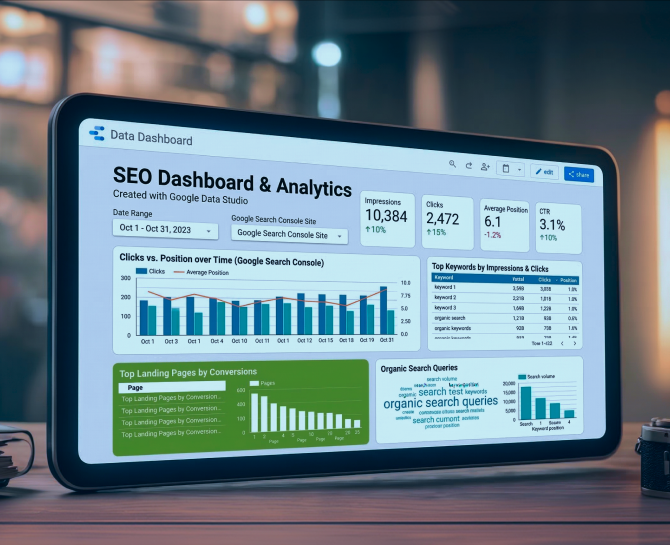
An SEO dashboard in Google Data Studio (now Looker Studio) is a live, visual report that centralizes your most important search performance metrics in one place. Instead of pulling data from multiple tools into a spreadsheet after the fact, it updates automatically and gives every stakeholder a single source of truth. The goal is not just to display data but to surface the right data in a format that makes the next decision obvious.
Most SEO reports are built after the fact. Someone pulls data from Google Analytics, grabs keyword rankings from a separate tool, copies it all into a spreadsheet, and sends a PDF by the end of the week. By the time anyone reads it, the data is already stale.
A well-built SEO dashboard in Google Data Studio changes that. Instead of reporting on what happened, it shows what’s happening so you can act while it still matters.
Key Takeaways
- Most SEO reports are built after the fact, and by the time anyone reads them, the data is already stale. A live Looker Studio dashboard replaces reactive reporting with something teams can actually act on.
- SEO data lives across multiple platforms. Search Console, Google Analytics, rank trackers, and CRM tools each show a partial picture. A well-built dashboard connects those sources so a drop in traffic can be traced to its cause in minutes, not hours.
- Including every available metric creates noise, not clarity. The best dashboards track only the numbers that influence a decision, and every chart earns its place by answering a specific question.
- Filters and date range controls make one dashboard useful for multiple audiences. An executive reviewing quarterly growth and a content manager checking page-level engagement can both get what they need from the same report.
- AI is shifting SEO dashboards from passive performance records to active decision-support tools, with anomaly detection, automated summaries, and predictive traffic forecasting now available inside Looker Studio itself.
What Is an SEO Dashboard in Google Data Studio?
Definition and Purpose
An SEO dashboard in Google Data Studio (now officially called Looker Studio) is a live, visual report that centralizes your most important search performance metrics in one place. It pulls data automatically from connected sources and updates in real time, removing the manual work from reporting and giving every stakeholder a single source of truth.
The goal isn’t just to display data. It’s to surface the right data in a format that makes the next decision obvious. A good dashboard doesn’t require the reader to know what to look for. It shows them.
What Is Google Data Studio (Looker Studio)?
Looker Studio is Google’s free data visualization and reporting tool. It connects to over 800 data sources through native and third-party connectors, including Google Analytics, Search Console, Google Ads, and tools like Ahrefs and SEMrush via partner connectors.
Unlike static spreadsheet reports, Looker Studio dashboards are interactive. Viewers can filter by date range, device, country, or landing page without touching the underlying data. Reports can be shared via link or scheduled for automatic email delivery. And because it’s free, it replaces tools that cost enterprise teams thousands of dollars per month.
Why You Need an SEO Dashboard
SEO data doesn’t live in one place. Search Console tracks impressions and queries. Google Analytics tracks sessions and conversions. Rank trackers monitor keyword positions. Each platform gives a partial picture, and decisions made on partial pictures are often wrong.
A Looker Studio SEO dashboard connects those sources into one view. A drop in organic traffic can be traced immediately to a position shift, a CTR decline, or a technical issue, rather than requiring an hour of cross-referencing across tools.
For agencies, the collaboration benefit is equally significant. Dashboards can be shared with clients in real time, with viewing or editing permissions set as needed. That transparency cuts down on status emails, builds trust, and keeps reporting from becoming a bottleneck.
Key Metrics to Include in an SEO Dashboard
Building a useful dashboard starts with deciding what to track. Including every available metric creates noise. The metrics below cover the core of what matters across most SEO programs.
- Organic traffic (users and sessions from organic search) is the baseline health indicator. Tracked over time, it shows whether the program is growing, flat, or declining.
- Keyword rankings and impressions from Google Search Console show where pages are appearing in search and how often. Position tracking by query identifies gains worth accelerating and drops worth investigating.
- Click-through rate (CTR) measures how often searchers click through to the site after seeing it in results. A high impression count with a low CTR usually signals a title or meta description that isn’t converting visibility into traffic.
- Bounce rate and engagement metrics indicate whether visitors are finding what they came for. High bounce rates on high-traffic pages often point to a content or UX issue worth addressing.
- Backlinks and domain authority track off-page SEO signals. Monitoring new and lost links over time helps connect link-building activity to ranking changes.
- Conversions and goal completions tie SEO directly to business outcomes. Only 0.63% of searchers click through to page two results, which means organic visibility has a direct commercial value that belongs in every SEO report.
Data Sources for Your SEO Dashboard
- Google Analytics (GA4) provides traffic, user behavior, and conversion tracking. It’s the foundation for understanding what organic visitors do once they arrive.
- Google Search Console is the source for impressions, clicks, average position, and query-level data. It’s the only tool that shows how Google sees your site, making it non-negotiable for any SEO dashboard.
- Third-party SEO tools like Ahrefs, SEMrush, and Moz can be connected via Google Sheets or partner connectors, bringing in backlink data, keyword difficulty scores, and competitive rankings that neither GA4 nor Search Console provides.
- CRM and conversion tools close the loop between marketing and revenue, letting you track not just traffic volume but the quality and commercial value of what your organic program is generating.
How to Create an SEO Dashboard in Google Data Studio
Step 1: Connect Your Data Sources
Go to lookerstudio.google.com and sign in with your Google account. Click “Create” then “Report.” Add your first data source by clicking “Add Data.” Connect Google Analytics and Google Search Console first, as these are the core of most SEO dashboards. GA4 and Search Console integrate instantly through native connectors.
For third-party tools, use connector platforms or export data to Google Sheets and connect Sheets as a data source. Connect sources in order of priority so the report structure reflects what matters most.
Step 2: Choose a Template or Build from Scratch
Looker Studio provides free SEO dashboard templates pre-built with standard metrics and themes. Templates save four to six hours of initial setup time and provide a reasonable starting point for most teams. Clone a template, reconnect it to your data sources, and then adjust as needed.
Building from scratch provides more control over layout and data blending, but takes much longer. For most use situations, starting with a template is the quickest way to create an effective dashboard.
Step 3: Add Key SEO Metrics and Dimensions
Use scorecards for top-line KPIs like total organic sessions, average position and conversions. Use time series charts to track trends. Use tables to break down performance by landing page, query, or country.
In Looker Studio, every visualization has a data source, a metric, and a dimension. A table showing keyword performance would use “Query” as the dimension and “Clicks,” “Impressions,” and “CTR” as metrics. Getting these combinations right is what separates a useful table from a confusing one.
Step 4: Design for Clarity
Put an overview page at the top of the dashboard, followed by traffic and behavior, conversions, and keyword performance. Throughout, stick to the same chart kinds, colors, and font sizes. Instead of just displaying data, each segment should address a particular subject.
Don’t include charts that don’t help with decision-making. A cluttered dashboard is disregarded. A concentrated one is employed.
Step 5: Add Filters and Date Range Controls
Add a date range control at the top of every page so viewers can adjust the reporting window without leaving the dashboard. Add dropdown filters for device type, country, and landing page to make the report interactive.
Filters make the dashboard useful for different audiences. An executive might want a quarterly traffic overview. A content manager might want page-level engagement for the past 30 days. One dashboard can serve both.
Step 6: Share and Automate
To distribute the dashboard, use a link with view or modify rights. The most recent version is automatically sent via scheduled email distribution for customer reporting on a weekly, biweekly, or monthly basis. For agencies managing multiple accounts, Looker Studio’s 2025 responsive layout feature now ensures dashboards display properly on mobile, which matters when stakeholders are reviewing performance outside the office.
Best Practices for an Effective SEO Dashboard
- Keep track of measurements that are relevant to decisions rather than merely those that are simple to obtain. A number on the dashboard most likely shouldn’t be present if it won’t influence your next action.
- To add context, use segmentation. Compared to aggregate numbers alone, traffic split out by device, location, or landing page provides a more nuanced picture.
- Align the structure with business objectives: a B2B company needs pipeline contribution and lead quality, while an e-commerce site needs revenue statistics.
Examine the dashboard on a regular basis. Periodic reviews identify changes in SEO before they become more serious issues.
Common Mistakes to Avoid
- The most prevalent issue is tracking too many metrics. A dashboard that strives to show everything really highlights nothing.
- Ignoring conversion statistics reduces SEO to a traffic-building process. Rankings and impressions serve as means to an aim. If the dashboard does not reveal what organic traffic is truly producing, the most critical question remains unanswered.
- Poor visualization design makes accurate data difficult to act upon. A well-structured table communicates more effectively than a cluttered chart that attempts to display five metrics at once. Not connecting data sources creates gaps that separate platforms cannot cover on their own.
The Role of AI in SEO Dashboards
The 2025 anomaly detection function in Looker Studio automatically detects anomalous changes in data, notifying teams when traffic declines or CTR increases without requiring a manual review. Instead of leaving interpretation up to the viewer, AI-generated summaries may contextualize changes across data sources and highlight the most pertinent insight.
Google Sheets-connected predictive analytics solutions can provide forecast data to dashboards, displaying trends in traffic or rankings over the next 30 to 90 days. SEO dashboards are evolving from passive performance records to active tools for decision support as AI becomes more integrated into the reporting layer.
Final Thoughts
An SEO dashboard in Google Data Studio is not just a reporting upgrade. It’s a change in how a team relates to its data. The difference between checking a spreadsheet once a week and having a live, filterable view of performance across every relevant dimension is the difference between reactive and proactive SEO.
The teams getting the most out of Looker Studio aren’t the ones with the most data. They’re the ones who’ve built dashboards that make the most important information impossible to miss.
Ready to get started?
Increase your marketing ROI by 30% with custom dashboards & reports that present a clear picture of marketing effectiveness
Start Free Trial
Experience Premium Marketing Analytics At Budget-Friendly Pricing.

Learn how you can accurately measure return on marketing investment.

You’re Targeting Your Ideal Customer. So Why Aren’t They Buying?
Your best customers reveal the traits associated with success. Your lost opportunities reveal where fit breaks...
Read full post post
How Predictive AI Will Transform Paid Media Strategy in 2026
Paid media isn’t a channel game anymore, it’s a chessboard. Search, social, programmatic, video, influencer, native,...
Read full post post
Don’t Let AI Break Your Brand: What Every CMO Should Know
AI isn’t just another marketing tool. It’s changing how we connect with customers, personalize content, and...
Read full post postFAQ's
It is a live, visual report built in Looker Studio that pulls data automatically from sources like Google Analytics and Search Console. It centralizes key SEO metrics in one place and updates in real time, removing manual reporting work.
Yes. Looker Studio is free and connects to over 800 data sources through native and third-party connectors, replacing tools that can cost enterprise teams thousands of dollars per month.
The core metrics are organic traffic, keyword rankings, impressions, CTR, bounce rate, backlinks, and conversions. The right set depends on your goals, but every metric included should connect to a decision, not just fill space.
Tools like Ahrefs and SEMrush can be connected via partner connectors or by exporting data to Google Sheets and linking Sheets as a data source. GA4 and Search Console connect instantly through native integrations.