
The Significance of Building a Time Decay Attribution Model with Python
Understanding which marketing touchpoints drive conversions is key to optimizing campaigns. In this guide, we break down Time Decay Attribution with Python, from data preparation to advanced modeling techniques. Learn how to assign weighted credit to interactions based on their recency and maximize your marketing ROI.
Explanation of Time Decay Attribution Model
The use of the time decay attribution model with Python calculates the value of marketing touchpoints by assigning higher weights to interactions closer to the conversion event. Unlike other attribution models, such as first-touch or linear, time decay acknowledges the importance of recency in influencing user decisions.
For example, if a user interacts with multiple marketing channels over two months, the touchpoints closer to the final conversion receive more credit than those occurring earlier.
This model assumes that recent interactions have the strongest influence on users’ actions. The weight assigned to each touchpoint decreases exponentially as the interaction and conversion time gap grows. By doing so, time decay ensures that marketers focus their resources on campaigns and channels that drive results in the near term.
Key Takeaways
- Time decay attribution assigns greater credit to marketing touchpoints closer to conversion, reflecting their stronger influence on buyer decisions.
- Compared to other attribution models, time decay provides a dynamic view of customer journeys by weighting interactions based on recency.
- Leveraging Python for tracking, modeling, and visualization enhances accuracy, enabling marketers to refine campaigns for maximum impact.
- Weighted attribution ensures better budget allocation by identifying high-impact channels, improving marketing efficiency and return on investment.
How Time Decay Gives Credit to Channel Interactions
Time decay attribution uses a systematic framework to distribute credit across touchpoints. It evaluates channel interactions about their proximity to the conversion. For instance, in a multi-channel scenario involving email marketing, paid search ads, and social media, the model calculates how each channel contributes to the desired outcome based on timing.
- Closer interactions:
- Earlier touchpoints:
A retargeted ad clicked one day before purchase might receive the majority of the credit.
An initial email that introduced the user to your product weeks prior would still get recognition, but its contribution will hold less significance.
This structured allocation helps marketers gain granular insights into the specific role played by each channel in the customer journey.
The Rationale Behind Assigning More Weight to Recent Touchpoints
Time decay attribution is rooted in behavioral patterns seen in buyer decisions. The model reflects how individuals are naturally more likely to remember—and be influenced by—recent information. Events that happen closer to a decision point hold stronger psychological salience compared to older events.
Additionally, marketing campaigns often rely on immediacy to trigger conversions. A discount email sent only hours before checkout or a real-time ad may deliver the final nudge toward conversion. Giving recent touchpoints more weight accounts for this reality, allowing businesses to optimize their budgets by pinpointing high-impact strategies.
To illustrate, consider a seven-day journey where a customer interacts with multiple channels. A time decay model would likely assign 50% of the credit to a paid ad clicked on the final day, 30% to a social media interaction three days prior, and only 20% to an email sent a week earlier. Such attribution reveals the declining impact of earlier touchpoints, reinforcing the need for timely marketing efforts.
Implementing Conversion Tracking on a Website
Successful conversion tracking starts with clearly defining the key actions users take on your website. These might include purchasing a product, signing up for a newsletter, or downloading a resource. For websites using Google Analytics, set up Goals or utilize Google Tag Manager to track these events efficiently. Similar techniques apply to other platforms such as Adobe Analytics or Mixpanel by embedding JavaScript snippets into your website.
Once tracking scripts are in place, validate their performance by monitoring event logging in real-time. Tools like Chrome Developer Tools or Tag Assistant help identify configuration errors and confirm tracking accuracy. Real-time testing ensures that all relevant user interactions are captured, creating a robust foundation for downstream attribution analysis.
Aligning Conversion Tracking for Time Decay Attribution
To facilitate Time Decay Attribution Modeling, data collection needs to account for the chronology of touchpoints in the buyer’s journey. Implement custom parameters or UTM tags on campaign links to capture channel, campaign, and time-specific data. This ensures granularity in tracking, which is critical for calculating decaying weights for each touchpoint.
Beyond basic events, include timestamps and user identifiers in your data architecture. This allows later integration with Time Decay algorithms in Python. For instance, a dataset where each row contains timestamps, channel types, and user-specific IDs creates a structured input for modeling both attribution sequences and decay rates.
- Embed custom UTM parameters to track campaign-specific interactions.
- Log timestamps and associate them with individual user journeys.
- Store raw data in structured tables or databases for advanced analysis.
Automating Conversion Tracking with Python
Python simplifies many aspects of conversion tracking and preprocessing through automation. Libraries such as Pandas and NumPy provide tools to ingest raw tracking logs, clean the data, and organize it into structured formats. For instance, regular expression operations in Python can automate the parsing of referrer URLs to classify traffic sources by Medium or Campaign.
Incorporating APIs like Google Analytics Reporting API significantly reduces manual effort in data collection. Use Python to extract event data directly from analytics platforms and sync it with your internal database.
Pro Tip- Automate data extraction using Python’s Google Analytics Reporting API and schedule scripts with cron jobs or Airflow to maintain real-time conversion tracking without manual intervention.
Building a Time Decay Attribution Model with Python
Marketing analytics has transformed with the use of Python due to its flexibility, rich libraries, and adaptability in diverse datasets. Python simplifies creating an accurate Time Decay Attribution model, allowing marketers to allocate credit to touchpoints based on their proximity to a conversion event. Follow this comprehensive guide to construct a Time Decay Attribution model with Python step by step.
Preparing Your Dataset
A clean and structured dataset is the foundation for any attribution model. Collect granular touchpoint data that includes:
- Customer ID or session ID (to identify unique interactions).
- Date or timestamp (to calculate the decay factor for each touchpoint).
- Source or channel (such as email, paid search, or social media).
- Conversion label (binary or numeric to mark conversion).
Save this data as a CSV file or load it directly from your data warehouse using APIs or Python’s SQLAlchemy library. Ensure data integrity by handling duplicates and any missing entries for key fields.
Data Analysis with Pandas
Use the pandas library to inspect, clean, and prepare the data for modeling. Begin by loading your dataset. Explore the dataset with a few commands like data.head() to visualize the structure and data.describe() to summarize numerical data. Add a calculated column reflecting each touchpoint’s ‘days before conversion’ for decay weight calculations. Finally, group interactions by Customer ID or session for sequential tracking of touchpoints.
Implementing Time Decay Logic
Time Decay Attribution assigns exponentially decreasing weights to interactions further away from conversion. Translate this logic into code by applying mathematical decay functions. At this stage, you’ll have a dataset where each touchpoint’s contribution to a conversion is proportional to its normalized decay weight.
Handling Multiple Client Datasets
If working with data from multiple clients or campaigns, structure the process to loop through datasets efficiently. A Python generator function is a good choice for this. Combine the processed results into a final summary dataset using concatenation functions like pd.concat() for visualization and reporting.
With this foundational workflow, Python enables robust and reusable Time Decay Attribution logic suited for marketing datasets of any size.
Pro Tip- Optimize your Time Decay Attribution model by precomputing decay weights using NumPy’s exp() function for efficiency. Store processed datasets in a structured database for seamless scalability across multiple campaigns.
Data Visualization for Time Decay Attribution
Visualizing attribution data effectively uncovers patterns and insights that can guide strategic decisions. Python libraries like Matplotlib and Seaborn offer versatile tools for creating clear and impactful visual representations of time decay attribution models. By plotting key metrics and presenting the diminishing value of touchpoints over time, marketers can make data-driven determinations regarding campaign impacts.
Using Python Libraries for Visualizing Attribution Data
Matplotlib and Seaborn simplify the process of creating visual graphs and plots. Starting with Matplotlib, basic line or bar charts can effectively display the contributions of different marketing channels over time. For instance, a graph plotting time on one axis and channel value on the other clearly illustrates how the weight of each touchpoint decreases as more time passes since conversion.
- Matplotlib Example:
- Seaborn Example:
- Overlay multiple lines or bars to compare the decay patterns across several campaigns.
Use plt.plot() for line graphs that show the decayed contribution of touchpoints in chronological order.
Employ sns.barplot() to create bar plots for channel-by-channel comparisons of attributed value.
Interactive visualizations can further enhance comprehension. Libraries like Plotly or Altair help create interactive plots where a user can hover over data points to get additional details, but Seaborn’s built-in style features often suffice for publication-ready visuals.
Demonstrating the Customer Journey Through Visualization
The customer journey often involves multiple touchpoints that contribute unequally to final conversions. Representing this visually helps expose the diminishing value of each touchpoint relative to its distance from the conversion event. For example, a heatmap created with Seaborn’s sns.heatmap() displays the cumulative influence of channels over time intervals. Alternatively, stacked bar charts reveal how each touchpoint layer contributes to the total conversion value.
- Sequential Weighting Chart:
- Touchpoint Comparison:
- Decay Function Visualization:
Illustrate the decay curve of weights applied to marketing interactions based on their chronological placement.
Create multi-layered visuals where shorter bars or fading colors represent lesser influence at distant stages from the conversion.
Generate plots of the decay function itself to provide transparency on model mechanics.
Consider a scenario where a paid search click kickstarts the journey, followed by multiple email openings leading to final conversion. A visualization of this journey could assign a darker color or larger bar to the paid search event, with progressively lighter colors or shorter bars signifying diminishing contributions of the later email interactions.
Visualizations, when executed well, clarify how touchpoints contribute to conversions under the time decay attribution model. They not only validate the efficacy of the model but also provide actionable insights to optimize future campaigns.
Pro Tip- Enhance attribution insights by integrating interactive dashboards using Plotly Dash or Streamlit. This enables real-time filtering and deeper exploration of campaign performance across multiple dimensions.
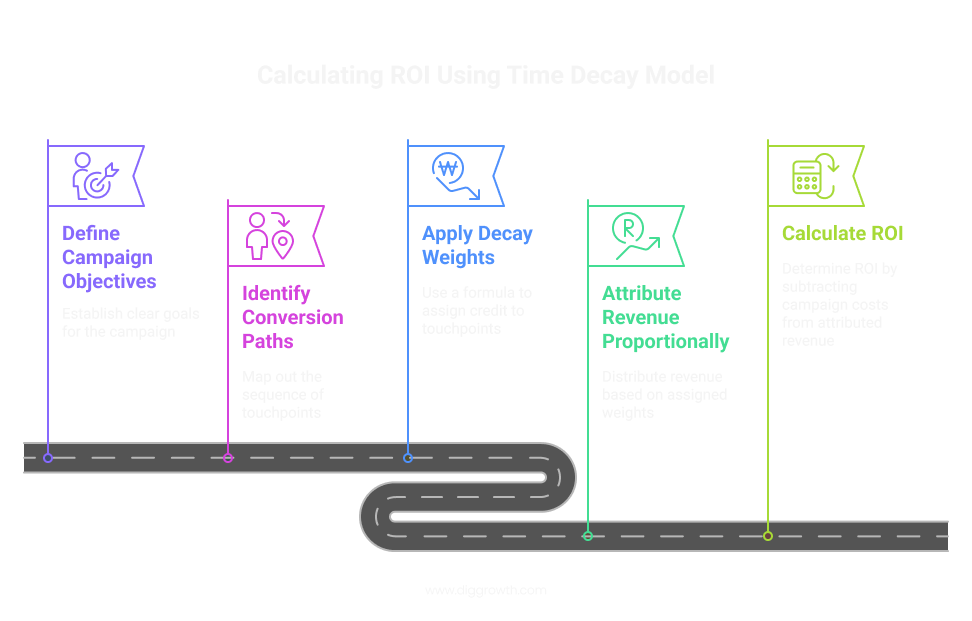
Calculation of Marketing ROI with Time Decay Attribution
Understanding Marketing Return on Investment (ROI)
Marketing Return on Investment (ROI) quantifies the financial return from marketing efforts relative to the investment made. It is often calculated as:
ROI = (Revenue Attributable to Marketing – Marketing Investment) / Marketing Investment
This metric connects marketing performance directly to revenue, enabling decision-makers to optimize strategies for maximum profitability. The challenge lies in accurately attributing revenue to specific marketing activities, particularly in multi-touch customer journeys.
Applying the Time Decay Model to Calculate ROI for Marketing Campaigns
Why Weighted Attribution Enhances ROI Calculations
Uniform attribution models, like First-Touch or Last-Touch, fail to capture the complexity of real-world customer journeys. A Time Decay approach weights touchpoints based on their relative importance, creating a more balanced view of campaign performance. For example:
- A paid search ad that first engages a user might receive 10% credit.
- Email follow-ups mid-journey might receive 20% credit.
- Paid social ads shown just before a conversion could receive 70% credit, given their proximity to the action.
This weighted distribution identifies underperforming and high-impact channels more effectively. Campaign managers can adjust budgets, focusing on high-ROI activities, and eliminating wastage from less impactful efforts, improving overall efficiency.
Integrating this framework in Python allows for scalability. By automating attribution calculations through data pipelines, practitioners can handle larger datasets and generate actionable insights with greater accuracy.
Advanced Techniques in Time Decay Attribution
The Intersection of Data Science and Time Decay Attribution in Marketing
Time decay attribution thrives on the intersection of marketing expertise and data science principles. By leveraging advanced statistical methods, marketers can refine how credit is distributed across touchpoints. For instance, statistical smoothing techniques such as exponential smoothing can be applied to the decay factor, allowing the model to better adapt to variations in user behavior patterns.
Moreover, enhancing the granularity of the time data can yield deeper insights. Instead of limiting the decay model to fixed intervals (e.g., days or hours), dynamic time splines can be implemented to capture nuanced patterns in conversion paths. Tools like scikit-learn and statsmodels in Python streamline these processes, offering built-in support for time-based regression and kernel smoothing.
Machine Learning for Evolving the Time Decay Model
Machine learning algorithms can take time decay attribution to the next level. Gradient Boosting Machines (GBMs), such as those implemented in XGBoost or LightGBM, allow for the identification of complex, non-linear relationships between touchpoints and conversions. By incorporating features such as channel type, time since first touch, and behavioral metrics (e.g., session duration or frequency), these models can dynamically evolve the decay rates based on historical data.
Another application lies in reinforcement learning. Algorithms like Q-learning can optimize the decay rate by simulating large sets of attribution scenarios and determining which produces the most accurate forward-looking performance predictions. The process can be hosted on cloud platforms such as Google Vertex AI or Amazon SageMaker to manage computational demands.
How Algorithmic Attribution Modeling Fits with Time Decay
Algorithmic attribution modeling provides a broader framework within which time decay attribution can operate. While rules-based methods (such as last-click or linear models) assign fixed weights, algorithmic approaches use data-driven techniques to calculate attribution weights dynamically. Time decay complements this by adding a temporal dimension, ensuring touchpoints closer to conversion retain higher priority.
For example, Shapley values—a concept borrowed from cooperative game theory—can be combined with time-weighted importance to produce hybrid models. In Python, libraries such as Shap allow for straightforward implementation and visualization of these effects. Additionally, Markov chains, accessible via libraries like pyMC, further enrich the attribution model by accounting for both probabilistic transitions and temporal decay effects.
These advanced approaches enable marketers to model increasingly intricate customer journeys. As datasets grow and paths to conversions diversify, integrating algorithmic frameworks with time decay creates a robust attribution strategy grounded in both theoretical rigor and real-world practicality.
Pro Tip- Combine Shapley values with Time Decay Attribution to uncover both channel importance and recency effects. Use SHAP in Python to visualize how each touchpoint’s influence evolves dynamically over time.
Unlocking the Full Potential of Time Decay Attribution
Time decay attribution models offer a transformative approach to understanding the customer journey in digital marketing. They allocate credit to touchpoints closer to conversion, aligning with the temporal nature of customer decision-making. This method enables marketers to identify high-value interactions, optimize campaigns, and ultimately maximize return on investment (ROI).
As digital marketing increasingly embraces data-driven decision-making, models like time decay attribution stand out for their precision and practical applications. By leveraging Python, marketers gain access to powerful libraries and tools for building, testing, and refining these models. The scalability and flexibility of Python make it an indispensable resource for attribution analysis, especially in complex and fast-changing marketing environments.
Using the time decay attribution model with Python can propel your business to great heights.
If you are willing to explore the efficiency of the time decay attribution clubbed together with Python, Just write to us at info@diggrowth.com and we’ll get back to you.
Ready to get started?
Increase your marketing ROI by 30% with custom dashboards & reports that present a clear picture of marketing effectiveness
Start Free Trial
Experience Premium Marketing Analytics At Budget-Friendly Pricing.

Learn how you can accurately measure return on marketing investment.

How Predictive AI Will Transform Paid Media Strategy in 2026
Paid media isn’t a channel game anymore, it’s...
Read full post post
Don’t Let AI Break Your Brand: What Every CMO Should Know
AI isn’t just another marketing tool. It’s changing...
Read full post post
From Demos to Deployment: Why MCP Is the Foundation of Agentic AI
A quiet revolution is unfolding in AI. And...
Read full post postFAQ's
The Time Decay Attribution model prioritizes recent interactions by assigning them higher credit, making it effective for understanding the immediate impact of marketing touchpoints on conversions.
Python simplifies data processing, attribution modeling, and visualization through libraries like Pandas, NumPy, and Matplotlib. It also enables automation and integration with analytics tools via APIs.
E-commerce, SaaS, digital advertising, and lead-generation businesses benefit from Time Decay Attribution, as it helps optimize campaigns by identifying recent high-impact marketing touchpoints.
Unlike linear or position-based models, Time Decay gives higher weight to recent interactions, making it more effective for businesses with short sales cycles or time-sensitive conversions.
Yes, advanced techniques like Gradient Boosting Machines (GBMs) or Markov chains can refine attribution by dynamically adjusting decay rates based on historical conversion data.