From Google Data Studio to Looker Studio: A New Era of Business Intelligence
The transition from Google Data Studio to Looker Studio ushers in a new era for data visualization and business intelligence, empowering businesses with interactive, insightful dashboards. Looker Studio's extensive connector ecosystem integrates data from various sources, transforming raw metrics into actionable intelligence, which drives smarter, faster decision-making across all levels of an organization.
The transition from Google Data Studio to Looker Studio marks a significant leap in data visualization and business intelligence. Looker Studio is a platform that transforms data into interactive, visually compelling reports and heralds advanced capabilities for analyzing and sharing insights.
Understanding Looker Studio’s Place in the Business Intelligence Landscape
Looker Studio is a pivotal tool in businesses aiming for a competitive edge. By converting raw data into actionable intelligence, Looker Studio empowers organizations to make informed decisions swiftly and confidently. The platform’s user-friendly interface facilitates the synthesis of complex information from many sources, forging a comprehensible narrative even for those outside the analytical domain.
Explore Highly Acclaimed Looker Studio Connectors
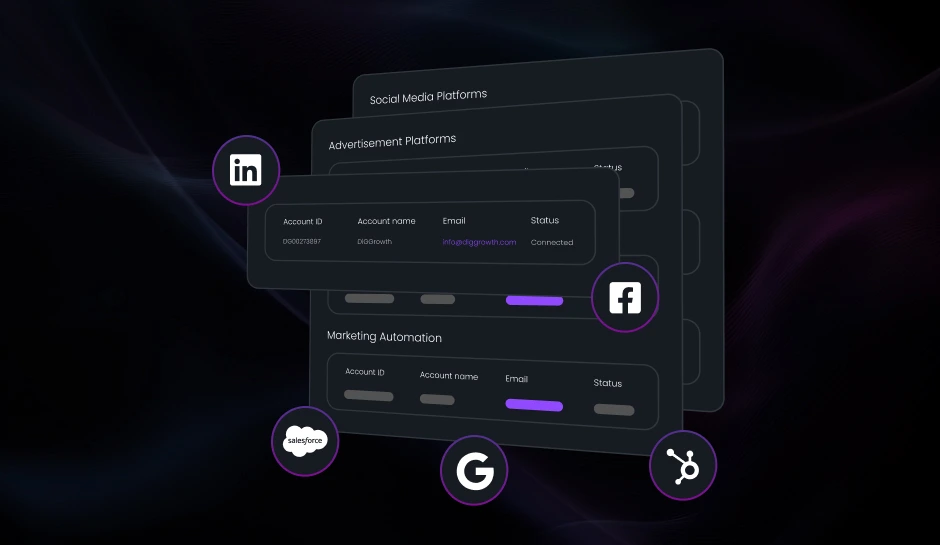
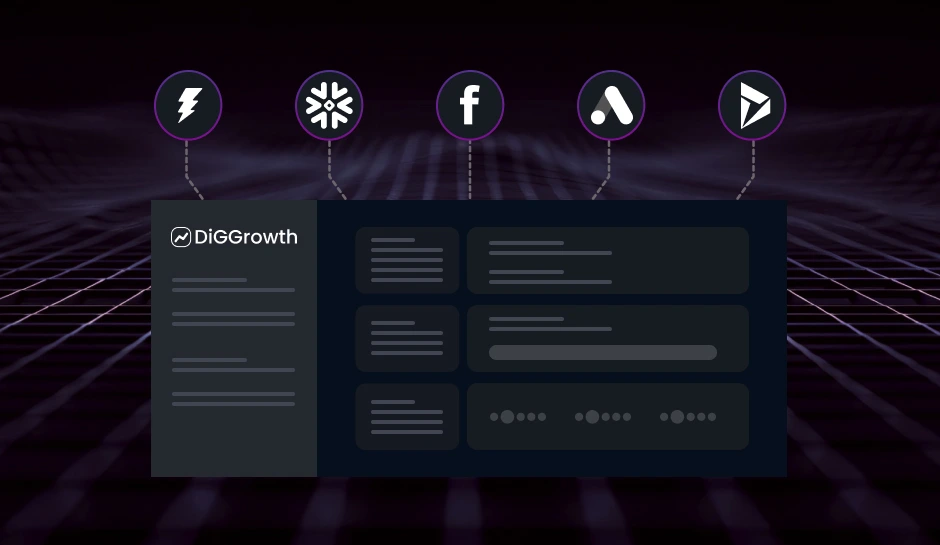
With many Looker Studio connectors available in the market, users can seamlessly integrate a wide range of data sources with their dashboards. Some connectors stand out for their robustness and popularity among data analysts and marketers.
Overview of Market-Leading Connectors
Users navigating the expansive catalog of Looker Studio connectors will encounter options to accommodate various data reporting requirements. The Google Analytics connector, a cornerstone in this assembly, enables direct access to web analytics data. Another standout is the Google Ads connector, which facilitates the integration of rich advertising metrics. For multi-platform data aggregation, the Supermetrics connector offers extensive service, pulling data from platforms like Facebook, Twitter, and LinkedIn.
Spotlight on Connectors Relevant to Google and Marketing Efforts
- The Google Search Console connector seamlessly executes deep dives into marketing metrics, empowering users to examine search performance in detail.
- The Google Sheets connector remains essential for professionals, promoting versatile data imports from spreadsheets.
- YouTube Analytics also joins the suite, presenting an avenue for video performance assessments.
Review of Data-Centric Connectors for Enhanced Metrics
For those focusing intently on data, connectors like BigQuery directly link to massive data stores, facilitating big data analytics. SQL databases are also easily accessible via the native SQL connector, streamlining database querying processes. Salesforce connector emerges as a critical tool for CRM data analysis, while the Amazon Redshift connector streamlines data extraction from the cloud data warehouse.
Pro Tip – When choosing Looker Studio connectors, prioritize those that align with your reporting needs and data sources. Integrating the right connectors, like Google Analytics for web metrics or Salesforce for CRM insights, enhances your ability to derive actionable insights efficiently.
Effortless Google Services Integration with Looker Studio Connectors
Users seeking streamlined ways to integrate their data for compelling visualizations find a seamless solution in Looker Studio’s connectors for Google Services. These connectors allow for direct interaction with a suite of Google tools, enhancing the ability to gather, analyze, and display data.
Simplifying Integration with Google Sheets for Data Aggregation
Through the Looker Studio connector, Google Sheets becomes a centralized repository for data. It simplifies data aggregation, as automating data import from Sheets into Looker Studio dashboards eliminates manual entry, reduces errors, and saves time.
Leveraging Google Analytics for Rich Insights into User Behavior
Through integration with Google Analytics, businesses gain in-depth insights into user behavior. The connector pulls performance metrics and user data directly into Looker Studio, providing a detailed landscape of visitor interactions across websites or applications.
Data Preparation and Transformation for Looker Studio
Before Looker Studio displays data in compelling visual formats, the raw data must undergo meticulous preparation and transformation. Cleaning and structuring data directly influences the clarity and effectiveness of the generated reports. Practitioners methodically remove irrelevant items, correct errors, and condense data into usable formats. In addition, they often create new calculated fields to enrich analyses.
Techniques for Cleaning and Structuring Data for Reports
Cleaning data may encompass excluding duplicates, standardizing date formats, and managing null values. Proper structuring also involves sorting and categorizing information, improving accessibility for report users.
Looker Studio’s built-in functionalities facilitate these procedures, allowing smooth integration of clean and structured data. Compound sentences, such as utilizing formula fields to create metrics or dimensions, add to the versatility of the reporting tool.
Best Practices for Data Transformation Ensuring Connector Efficiency
Transforming data effectively requires understanding the nature of source systems. For instance, segmenting granular data into summarized information accelerates connector performance and enhances user experience.
Efficiency in data transformation hinges on identifying which transformations should occur pre- or post-connector import. Streamlined data models enable connectors to retrieve only the essential data, minimizing bandwidth and processing needs.
Streamlining Data Preparation to Serve Client Needs
Anticipating the end user’s reporting needs shapes the approach to data preparation. The design of a data schema should align with client objectives, incorporating business logic and hierarchy. This foresight ensures that the Looker Studio connectors deliver high-value, actionable insights.
Direct questions uncover the necessary data transformations for meaningful reporting during the planning phase. Ultimately, a well-prepared dataset allows Looker Studio to produce rich, dynamic, and interactive reports, catering to specific analytical requirements.
Pro Tip – To optimize data preparation for Looker Studio, always start with a clear understanding of your reporting objectives. Tailor your data cleaning and transformation processes accordingly, focusing on creating a logical data structure that aligns with user needs. This proactive approach not only enhances report clarity but also maximizes the efficiency of your connectors.
Maximize Your Looker Studio Dashboard’s Efficiency
Optimizing a Looker Studio dashboard enhances its performance and user satisfaction. Faster loading times and responsive interactions are crucial for an engaging analysis environment.
Fine-Tuning Dashboards for Quick Loading and Interaction
To accelerate dashboard responsiveness, streamline the number of widgets used. Each widget engages a query that can impact load times. Therefore, consolidate where possible to minimize queries. Moreover, leverage Looker Studio’s data extract feature to snapshot your data, reducing reliance on live connections and boosting loading speed.
Addressing Large Data Sets and Complex Metrics
Large data sets can strain dashboard performance. Prioritize preprocessing your data to trim unnecessary rows and columns before ingestion. This reduction simplifies the data model and enables the dashboard to function more effortlessly. If possible, precompute complex metrics requiring intense calculations within the data source. It shifts the computational load of the dashboard, facilitating a smoother user experience.
Advanced Uses of Connectors for Data Blending and Merging
With Looker Studio connectors, analysts blend data from disparate sources to reveal deeper insights not apparent from isolated datasets. This practice allows for the creation of enriched reports offering a multi-faceted view of business operations. Data blending involves combining data from multiple sources and creating a common dataset for analysis.
Techniques for Sophisticated Data Blending to Derive Deeper Insights
Data blending can resolve data mismatches and reconcile different dimensions or metrics. Professionals often use this technique to combine financial data with marketing metrics to ascertain the ROI of specific campaigns. One can pinpoint the customer journey’s effectiveness from initial touchpoints to conversion by connecting CRM data with web analytics through Looker Studio connectors.
Data blending goes beyond simple aggregation; it involves discerning patterns that direct strategic decision-making. For instance, blending social media engagement data with sales figures could uncover correlations between online brand interactions and purchasing behavior.
Exploring Merging Options for Enhanced Reporting Capabilities
Merging options in Looker Studio facilitate the consolidation of similar data sets for more comprehensive reporting. Users typically merge data when dealing with identical dimensions on different datasets, such as merging monthly sales reports from various regions to form a unified global sales overview. This consolidation leads to more streamlined and coherent reporting processes, allowing stakeholders to grasp overarching trends swiftly.
Looker Studio allows nuanced merging techniques, such as creating common keys to associate data from different sets. It means that sales data, customer feedback, and inventory levels from separate systems can be jointly analyzed to comprehend the nuances of supply chain efficiency and its impact on customer satisfaction.
Harnessing the Full Potential of Data Connectivity in Marketing Strategies
Marketers employ Looker Studio connectors to interlink advertising, sales, and customer interaction data for a holistic marketing strategy. This rich connectivity lets them see what channels drive traffic and which leads to conversions and strong customer loyalty. By harnessing multi-source data, marketers optimize campaigns in real-time, adjusting to market receptivity and maximizing ROI.
A practical example is synchronizing e-commerce platform data with weather forecasting sources. This data consortium can inform businesses when to ramp up marketing efforts for seasonal products. Therefore, weather patterns, connected via a Looker Studio connector, directly influence marketing strategies and inventory management.
Pro Tip- When blending and merging data with Looker Studio connectors, establish a clear set of common keys across your datasets. This practice ensures accurate associations and enriches your analysis. Additionally, consider visualizing your blended data in real-time dashboards to quickly identify trends and make data-driven decisions that can adapt to changing market conditions.
Best Practices for Data Visualization with Looker Studio
Data visualization elevates the comprehension of complex datasets. Creating impactful and clear dashboards in Looker Studio translates data into actionable insights, particularly for business and marketing strategies. When designing a dashboard, focus on representing the data truthfully and in a readily accessible format for decision-makers.
Designing Impactful and Clear Dashboards for Business and Marketing Needs
Dashboard creators should prioritize relevance and context. They should select metrics that align with strategic objectives and present them in a hierarchy where key performance indicators take precedence. Ensure that the visual elements guide users through the data story without overwhelming them with excess information.
Balancing Aesthetics and Functionality in Data Presentation
- To achieve balance, deliberately combine color schemes and typography.
- Color coding can highlight critical changes and trends, but using too many can be counterproductive.
- Stick to a theme that reflects your organization’s branding, but make sure it aids in the data analysis process.
- Typography is another tool for organizers.
- Use size and weight to draw attention to vital data points.
Select chart types that match the data structure and the message. For instance, time series data are best displayed in line graphs, while pie charts can quickly show part-to-whole relationships. Be mindful that your audience universally understands the chosen chart types.
Applying Visual Best Practices to Showcase Metrics Effectively
Visual best practices are paramount for effective metric showcasing. Labels and legends must be clear and concise, using language the target audience grasps swiftly. Data granularity should be appropriate for the dashboard’s purpose, detailed for analysts, and summarized for executives.
Consider interactivity features, such as hover actions, which can provide additional context or drill-down capabilities, enhancing the user experience. Annotations can explain sudden shifts in data or spotlight significant events that may affect business outcomes.
Strategic use of white space also improves readability, avoiding clutter that can obscure the data’s story. Lastly, ensure your dashboards are responsive and accessible on various devices, from desktops to mobile phones, to accommodate users in different environments.
Pro Tip- To enhance the effectiveness of your Looker Studio dashboards, regularly solicit feedback from end users to ensure that the visualizations meet their needs and expectations. Incorporate their insights to fine-tune your design and data representation, ensuring that dashboards remain intuitive, relevant, and impactful for decision-making processes.
Key Takeaways
- Looker Studio’s wide array of connectors allows users to seamlessly integrate diverse data sources, transforming raw data into actionable insights for informed decision-making.
- Proper data cleaning and structuring are crucial for optimizing Looker Studio dashboards. Techniques such as removing duplicates and standardizing formats improve clarity and efficiency in reporting.
- Looker Studio enables analysts to blend and merge data from multiple sources, revealing deeper insights and fostering comprehensive reporting that supports strategic decision-making.
- Designing impactful dashboards involves balancing aesthetics and functionality. Prioritizing key metrics, employing clear visual best practices, and ensuring responsiveness enhances user engagement and comprehension.
Master Your Data Narrative with Looker Studio Connectors
Looker Studio connectors are the backbone for businesses leveraging analytics for data-driven decision-making. They bridge disparate data sources, unleashing Looker Studio’s full potential for enhanced reporting and metrics analysis. Businesses gain nuanced insights into their operations, customer behavior, and market trends by recognizing the catalyst role these connectors play.
Adaptation to evolving data tools and platforms remains a non-negotiable for staying competitive. With its expanding array of connectors, Looker Studio stands at the forefront of this evolution. Harnessing its capabilities requires curiosity, continuous learning, and an unwavering commitment to refining data strategies.
Need help with Looker Studio Connectors?
Just write to us at info@diggrowth.com and we’ll get back to you.
Ready to get started?
Increase your marketing ROI by 30% with custom dashboards & reports that present a clear picture of marketing effectiveness
Start Free Trial
Experience Premium Marketing Analytics At Budget-Friendly Pricing.

Learn how you can accurately measure return on marketing investment.
Additional Resources
Integrating Data from Different Channels for a Holistic View of Your Marketing Performance
Who's your ideal customer? Where do they come...
Read full post postGet Your Channels to Play Nice: Integrated Data for Smarter Marketing
If you’re a savvy marketer, you’re living in...
Read full post postConsent-Based Analytics: Ensure Long-Term Marketing Success
As marketers, we want our customers to perceive...
Read full post postFAQ's
Looker Studio offers enhanced data modeling capabilities, improved collaboration features, and a more robust integration with Google Cloud services compared to Google Data Studio. This transition enables users to handle larger datasets and create more complex visualizations.
While Looker Studio aims to maintain compatibility with existing Google Data Studio reports, users may need to make some adjustments due to differences in features and functionalities. It’s advisable to review and update reports after migration.
Looker Studio provides advanced collaboration tools, allowing multiple users to work on reports simultaneously, leave comments, and share insights easily. This fosters teamwork and streamlines the decision-making process.
Yes, Looker Studio supports a wide range of connectors, including those used in Google Data Studio. Additionally, it offers new connectors for better integration with various data sources, enhancing data accessibility.
Users can access resources to learn Looker Studio, including official documentation, online tutorials, webinars, and community forums. These resources help users effectively leverage the platform’s capabilities for business intelligence.
 Richa Bhardwaj
  Sameer Pawar

