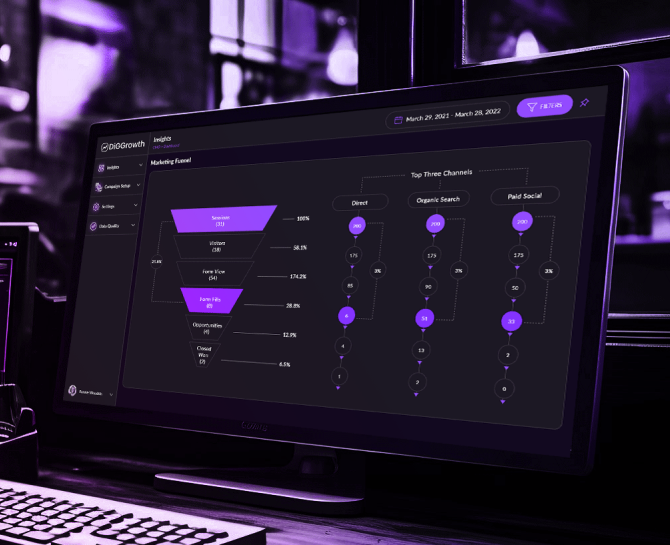
Mastering Website Performance with a Web Analytics Dashboard
A Web Analytics Dashboard helps you access and comprehend all the data related to the website and its customers on a single platform. In this blog, we have elaborately discussed the benefits and features of a dashboard to help you navigate efficiently to obtain the maximum advantages
Are you looking to unveil the secrets behind your website’s success or failure? Look no further than a powerful web analytics dashboard. In this article, we will explore the ins and outs of this invaluable tool, explaining its definition, highlighting its significance in tracking and analyzing website performance, and offering an overview of its essential components and features.
Understanding Data in a Web Analytics Dashboard
Overview of different types of data collected and analyzed:
Web analytics dashboards collect both quantitative and qualitative data. Quantitative data includes page views, bounce rate, conversion rate, and user demographics. On the other hand, qualitative data provides user feedback, surveys, and heat maps.
Explanation of data sources and how data is captured and processed:
Data in a web analytics dashboard is sourced from various channels, such as website trackers, social media platforms, and third-party integrations. It is captured using JavaScript code or tags placed on web pages. Once captured, the data is processed and organized to provide meaningful insights in the dashboard.
Key Performance Indicators (KPIs) in a Web Analytics Dashboard
Utilizing Key Performance Indicators (KPIs) in a web analytics dashboard is crucial to measuring website performance and success. KPIs provide valuable insights into your website’s performance and help you track progress towards your goals.
Common KPIs in Web Analytics
- Website Traffic:
- Conversion Rate:
- Bounce Rate:
- Average Session Duration:
This KPI measures the number of visitors your website receives. It helps you understand the level of interest and awareness your website generates.
The conversion rate KPI measures the percentage of visitors who complete a desired action on your website, such as purchasing or filling out a form. It indicates the effectiveness of your website in driving conversions.
Bounce rate measures the percentage of visitors who leave your website without interacting with it. A high bounce rate could indicate issues with user experience or content relevance.
This KPI measures visitors’ average time on your website. It helps you understand the engagement and interest users have with your content.
Using KPIs to Set Goals and Track Progress
KPIs help measure website performance and can also be used to set specific goals and track progress. By regularly monitoring the conversion rate KPI, you can track your progress towards achieving that goal and make necessary optimizations.
Key Performance Indicators (KPIs) are crucial in measuring website performance and success in a web analytics dashboard. By understanding the Importance of KPIs, utilizing common web analytics KPIs, and using them to set goals and track progress, you can optimize your website’s performance and achieve your desired outcomes.
Data Visualization in a Web Analytics Dashboard
Data visualization plays a crucial role in a web analytics dashboard by transforming complex data into easily understandable visuals. Businesses and website owners can quickly grasp insights and make informed decisions by presenting information visually.
Introduction to different visual formats
A web analytics dashboard employs various visual formats to present analytics data effectively. Some standard graphic formats include:
- Charts:
- Graphs:
- Heatmaps:
Line charts, bar charts, and pie charts are commonly used to represent quantitative data. Line charts effectively display trends over time, while bar charts compare categories or segments. Pie charts help illustrate the composition or distribution of data.
Graphs like scatter plots and bubble charts help explore relationships between multiple variables. They visualize correlations, clusters, and outliers, assisting analysts to identify patterns, trends, or anomalies.
Heatmaps use color intensity to represent the density or distribution of data points across a webpage or user interface. They provide insights into user engagement, click patterns, and areas of interest or concern.
Real-time Analytics in a Web Analytics Dashboard
Real-time analytics is a crucial aspect of a web analytics dashboard. It refers to the ability to monitor and analyze website data instantly as it occurs. You can access up-to-the-minute information about your website’s performance, traffic, and user behavior.
The benefits of real-time analytics are numerous. First, it lets you stay on top of your website’s performance in real-time. You can quickly identify any issues or anomalies and address them promptly. This level of immediacy enables you to make data-driven decisions and take immediate actions to optimize your website.
Real-time analytics provide immediate insights by presenting data in a live and dynamic format. You can visualize trends, monitor user behavior, track conversions, and analyze the performance of specific campaigns or marketing initiatives in real time. It allows you to identify opportunities and take advantage of them as they arise, avoiding delays in decision-making.
In addition to immediate insights, real-time analytics enable quick decision-making. With access to real-time data, you can respond promptly to changing conditions, adjust your strategies, and capitalize on emerging trends. This agility is particularly valuable in the fast-paced digital landscape, where adapting quickly can significantly impact your website’s success.
Metric Tracking in a Web Analytics Dashboard
When evaluating a website’s performance, various metrics provide valuable insights. These metrics are crucial in understanding how your website attracts and engages visitors. Tracking these metrics in a web analytics dashboard lets you gather data to make informed decisions about your website’s optimization strategies.
Overview of Various Metrics Used to Evaluate a Website’s Performance
In a web analytics dashboard, you will come across several metrics that give you a comprehensive view of your website’s performance. These metrics include:
- Page Views:
- Unique Visitors:
- Click-Through Rate (CTR):
- Conversion Funnel:
- Customer Engagement Metrics:
The number of times a specific page on your website has been visited. Page views help you understand the popularity and user engagement of your pages.
The number of individual users who have visited your website. It provides insights into the reach and audience size of your website.
The percentage of users who navigate to a specific page on your website by clicking on a link. CTR helps you assess the effectiveness of your call-to-action and content strategy.
A series of steps a visitor must go through to complete a desired action on your website, such as purchasing or filling out a form. Tracking the conversion funnel helps you identify where users drop off and optimize the user journey accordingly.
Metrics measure how users interact with your website, such as time spent on a page, bounce rate, and social media shares. These metrics provide insights into the level of engagement and interest your website generates.
Importance of Tracking and Analyzing Metrics
Tracking and analyzing metrics in a web analytics dashboard is vital for website optimization and decision-making. By monitoring these metrics, you can:
- Identify trends and patterns in user behavior, allowing you to optimize your website based on user preferences.
- Optimize performance by identifying areas of improvement, such as high bounce rates or low conversion rates.
- Make data-driven decisions by leveraging valuable insights derived from the metrics.
In conclusion, metric tracking in a web analytics dashboard provides you with the tools to evaluate and improve your website’s performance. By understanding the various metrics and their significance, you can gain valuable insights and make data-driven decisions to enhance your website’s success.
User Behavior Analysis in a Web Analytics Dashboard
Understanding user behavior is crucial for improving website usability and conversion rates. By analyzing how users interact with your website, you can identify areas for improvement and optimize the user experience.
Introduction to User Behavior Analysis Techniques
There are several techniques available for analyzing user behavior in a web analytics dashboard:
- Session Analysis:
- User Flow Analysis:
- Heatmaps:
- Behavior Segmentation:
Session analysis helps you understand how users navigate your website during a single visit. It provides insights into the most popular pages, entry and exit points, and the duration of each session.
User flow analysis tracks users’ paths as they move from one page to another on your website. It helps you understand users’ common paths and identify bottlenecks or drop-off points.
Heatmaps visually represent where users click, scroll, and hover on your website. They reveal the areas of the page that get the most attention and allow you to optimize the placement of essential elements.
Behavior segmentation involves grouping users based on their actions and behaviors on your website. By analyzing different user segments, you can tailor your marketing strategies and optimize the user experience for each segment.
User behavior analysis provides actionable insights that can be used to optimize your website. By understanding how users interact with your site, you can make informed design, content, and functionality decisions.
A/B Testing in a Web Analytics Dashboard
A/B testing, or split testing, is used in web analytics to compare two versions of a webpage or element to determine which performs better regarding user engagement, conversion rates, or other key metrics. This testing approach allows businesses to make data-driven decisions and optimize their website performance.
The benefits of A/B testing in web analytics are:
Improved conversion rates: A/B testing enables businesses to understand which design, content, or layout changes can increase conversions and drive desired user actions, such as purchases, sign-ups, or downloads.
- Data-driven decision-making:
- Reduced risk:
- Optimized user experience:
Rather than relying on assumptions or subjective opinions, A/B testing allows businesses to utilize objective data to make informed decisions about website optimization and enhancements.
By testing changes on a smaller scale before implementing them site-wide, businesses can mitigate the risk of negatively impacting overall performance.
A/B testing helps companies understand user preferences and behaviors. It allows them to tailor their website to provide a better user experience and meet users’ needs and expectations.
Introduction to best practices, tools, and methodologies for conducting A/B tests to improve website performance
When conducting A/B tests in a web analytics dashboard, it is essential to follow best practices to ensure accurate results and meaningful insights:
- Clearly define goals:
- Test one variable at a time:
- Segment your audience:
- Ensure statistical significance:
- Utilize reliable A/B testing tools:
The goals and objectives of your A/B tests to focus on specific metrics or key performance indicators (KPIs) that align with your business objectives.
To accurately assess the impact of a single change, such as a headline, button color, or layout, it is essential to test one variable at a time and isolate its effect on user behavior.
Segment your audience based on specific criteria, such as demographics, location, or behavior, to understand how different user groups respond to web page variations.
Allow sufficient sample size and testing duration to ensure statistical significance and confidence in your results. A larger sample size reduces the risk of random variations impacting the outcomes.
There are various A/B testing tools available, such as Google Optimize, Optimizely, or VWO, that provide robust features and statistical analysis capabilities to conduct and analyze tests effectively.
Mobile Analytics in a Web Analytics Dashboard
Mobile analytics is a crucial component of any web analytics dashboard. As more and more users access websites through their mobile devices, tracking and analyzing mobile website performance becomes essential in understanding user behavior and optimizing the mobile user experience.
One of the critical mobile metrics to track is mobile traffic, which measures the number of visitors accessing your website through mobile devices. This data provides insight into the popularity and reach of your mobile platform.
Another crucial mobile metric is the mobile bounce rate, representing the percentage of visitors who leave your website after viewing only one page. A high bounce rate could indicate issues with mobile usability or content relevance.
Mobile conversion rate is yet another crucial metric in mobile analytics. It measures the percentage of mobile visitors who complete a desired action, such as purchasing a product or filling out a form. By tracking the conversion rate, you can evaluate the effectiveness of your mobile marketing strategies and identify any pain points in the mobile conversion funnel.
When analyzed within a web analytics dashboard, all these mobile metrics can inform mobile optimization efforts. By identifying trends, patterns, and user preferences, you can enhance the mobile user experience, optimize mobile content and design, and ultimately increase mobile conversions.
Data Integration and APIs in a Web Analytics Dashboard
To provide a comprehensive view of your website’s performance, a web analytics dashboard should be able to integrate data from various sources. That is where data integration and APIs come into play.
Data integration refers to combining data from different sources and consolidating it into a unified view. APIs, or Application Programming Interfaces, act as the bridge that connects the web analytics dashboard with these other data sources.
Connecting with Various Data Sources
A web analytics dashboard can integrate with various data sources such as CRM (Customer Relationship Management) systems, social media platforms, advertising platforms, and e-commerce platforms.
- CRM Systems:
- Social Media Platforms:
- Advertising Platforms:
- E-commerce Platforms:
By integrating with CRM systems, the web analytics dashboard can analyze customer interactions and behaviors, allowing you to gain valuable insights into the effectiveness of your marketing and sales efforts.
Integrating with social media platforms enables you to track the performance of your social media campaigns, monitor engagement metrics, and understand how social media interactions contribute to your website’s success.
Connecting your web analytics dashboard with advertising platforms like Google AdWords or Facebook Ads allows you to track the performance of your ads, measure conversions, and optimize your advertising strategies based on real-time data.
Integration with e-commerce platforms such as Shopify or WooCommerce enables you to analyze sales data, track purchasing patterns, and identify opportunities for improving your online store’s performance.
In conclusion, data integration and APIs are crucial in connecting a web analytics dashboard with various data sources. By integrating CRM systems, social media platforms, advertising platforms, and e-commerce platforms, you can enhance the accuracy and completeness of your analytics data, leading to more informed decision-making and improved website performance.
Report Generation and Customization in a Web Analytics Dashboard
Importance of effectively communicating web analytics results and insights to stakeholders:
To make data-driven decisions, it is crucial to communicate web analytics results and insights to stakeholders effectively. By doing so, stakeholders can better understand their website’s performance and evaluate their online strategies’ success. Through clear and concise reporting, stakeholders can gain valuable insights and make informed decisions to improve their online presence.
Explanation of how to generate reports from the web analytics dashboard:
Generating reports from a web analytics dashboard is straightforward, allowing users to extract and present specific data meaningfully. Users can select the desired metrics, date ranges, and dimensions to include in the report. This customization ensures that the report focuses on the key performance indicators (KPIs) relevant to the stakeholders. After selecting the necessary parameters, the web analytics dashboard will generate the information, which can be exported or shared with stakeholders for further analysis.
By effectively communicating web analytics results and customizing reports, stakeholders can better understand their online performance and drive improvements in their digital strategies. The web analytics dashboard is a powerful tool to deliver valuable insights and facilitate data-driven decision-making.
Get your own personalized Web Analytics Dashboard by contacting us Talk to Us!
Here at DiGGrowth, we understand your organization’s marketing and analytics needs and offer you the best resources and platform. info@diggrowth.com and we’ll get back to you.
Ready to get started?
Increase your marketing ROI by 30% with custom dashboards & reports that present a clear picture of marketing effectiveness
Start Free Trial
Experience Premium Marketing Analytics At Budget-Friendly Pricing.

Learn how you can accurately measure return on marketing investment.
Additional Resources
The Future of Marketing: How Predictive Lead and Account Scoring is Changing the Game
Can we, in this incredible marketing landscape driven...
Read full post postCloud Wars: A Comparative Analysis of Leading Cloud Vendors
How many companies are using cloud computing? Around...
Read full post postContent Marketing Attribution: Tracking Content Impact Across the Customer Journey
So, you've poured your heart into crafting the...
Read full post postFAQ
Benefits of a Web Analytics dashboard: Centralized view of key website metrics. Quick insights for data-driven decision-making. Real-time monitoring of website performance. Enhanced efficiency in tracking and analysis.
Metrics included in the dashboard: Page views, unique visitors, and bounce rate. Conversion rates, user demographics, and source/medium data. Top-performing content and popular landing pages.
Yes, many web analytics dashboards are mobile-friendly. They are accessible on various devices for on-the-go insights.
Importance of a web analytics dashboard: Enables quick assessment of website performance. Facilitates informed decision-making for optimization. Enhances communication of critical metrics across teams. Supports proactive adjustments to marketing strategies
 Richa Bhardwaj
  Sameer Pawar

