
Master Your Metrics: A Beginner’s Guide to Checking Bounce Rate in Google Analytics 4
Checking the bounce rate helps you analyze your website's performance and the effectiveness of its content. Follow this blog to learn how to check and improve your website’s bounce rate with the help of Google Analytics.
Understanding how visitors interact with your website is vital, and bounce rate acts as the crystal ball, offering insight into their engagement- or lack thereof. But fear not, intrepid explorer, for you are about to embark on a journey that will unveil the secrets of how to check bounce rate in Google Analytics. Get ready to turn those numbers into narratives and make informed decisions to boost your site’s performance. Buckle up and prepare for a deep dive into the analytics that matters!
Key Takeaways
- Navigating and interpreting the bounce rate data within Google Analytics helps you assess user engagement on your site.
- Segmenting your data is crucial to understand different user behaviors and to tailor your optimization efforts accordingly.
- Comparing page-level bounce rates allows you to identify high and low-performing content to replicate success and address underperformance.
- Adjusting session time thresholds and ensuring proper tracking codes can refine your metrics for more accurate readings.
Understanding Bounce Rate
Bounce rate is the percentage of users who abandon a site in a couple of seconds after they land on it. They don’t follow any links and don’t interact with the page. Website bounce rate is one of Google’s ranking factors. The search engine’s algorithms consider a page with a high bounce rate irrelevant to users’ queries. It means that it doesn’t help people find answers to their questions. As a result, this page moves lower in the SERP, giving way to other more relevant pages.-spcdn.org
Now that you’ve been introduced to Google Analytics let’s dive deeper into one of the most critical measures for site performance and conversion- the bounce rate. But what exactly is it, and why does it matter to your online marketing success? Let’s find out!
What is the Bounce Rate?
In web analytics, bounce rate is defined as the percentage of visitors or page views who enter your site and then leave (“bounce”) rather than continuing to view other pages within the same site. Essentially, it’s a signal that the visitor didn’t find what they were looking for or the page wasn’t compelling enough to keep them engaged.
Why is Bounce Rate Critical?
Bounce rate is a vital metric because it gives insight into how your content resonates with your Audience. A high bounce rate could indicate that your website’s landing pages aren’t effective at capturing users’ interest or leading them further into your site’s content. It can affect your SEO ranking, your site’s conversion rates, and how effectively your site turns visitors into customers or leads.
To sum up, it’s essential to monitor your bounce rate. It indicates how well your site content engages your Audience and fulfills their needs.
Get Started with Google Analytics
Ready to dive into the world of web analytics? Setting up Google Analytics is the first crucial step to unlocking valuable insights about your website’s performance, including your bounce rate. Follow this easy step-by-step guide to get Google Analytics up and running on your site.
Step-by-Step Guide to Setting Up a Google Analytics Account
- Create a Google Analytics account.
If you haven’t already, visit the Google Analytics website and sign up for a free account using your Google account.
- Set up a property.
Once logged in, you must create a “property” for your website. Fill in your website’s name, URL, and other details as prompted.
- Configure your data-sharing settings.
Customize the data you share with Google and other services based on your preferences and requirements.
How to Implement the Tracking Code on Your Site?
With your Google Analytics account ready, it’s time to connect it to your website:
- Get your tracking code.
After creating your property, Google Analytics will provide a unique tracking code snippet. You need to add this to your website’s code.
- Install the tracking code.
Copy the tracking code and paste it before the closing tag on every site page you want to track. A plugin can simplify this process for WordPress sites.
- Check your setup.
Verify that the tracking code is working correctly. You can do this using Google Analytics or tools like Google Tag Assistant.
Once you’ve completed these steps, your Google Analytics is set to start collecting data! You can monitor your traffic, see user behavior, and check your bounce rate. But don’t worry; we’ll walk you through how to find and analyze your bounce rate in the upcoming sections.
Navigating to the Bounce Rate in Google Analytics
Learning to check the bounce rate in Google Analytics is a great place to start. A bounce rate can be an illuminating metric, giving you insight into your website’s performance. Let’s walk through the steps to find this golden nugget of data.
Accessing Bounce Rate Reports
To start, you’ll need to log into your Google Analytics account. Once logged in, follow these easy steps:
- Navigate to the Reporting section found in the top menu.
- In the left-hand sidebar, click on Acquisition to expand the list of options.
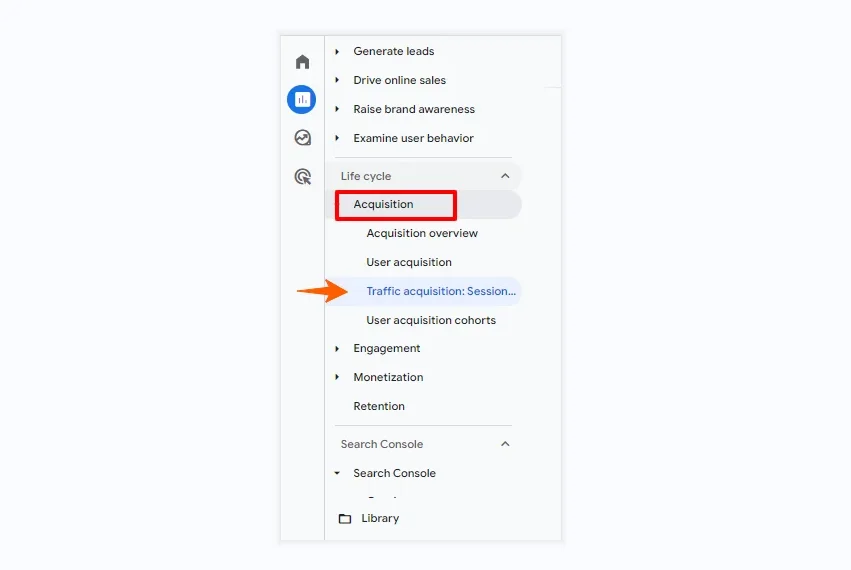
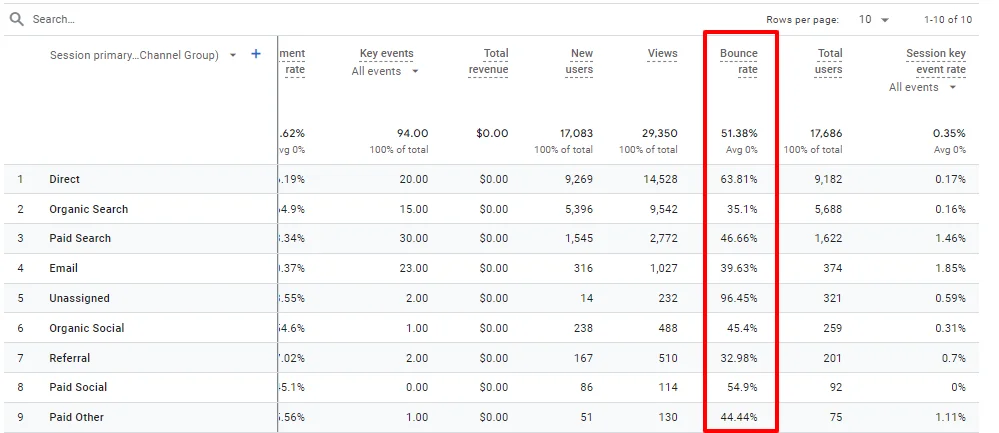
- Under Acquisition, click on traffic acquisition. Here is a snapshot that includes your site’s overall bounce rate.
Finding Bounce Rate for Individual Pages
If you’re curious about the bounce rate for specific pages, there’s a straightforward way to uncover that:
- In the same Reporting section, go to the Behavior category.
- Expand it and select Site Content.
- Now, click on All Pages. This report will show you the bounce rates for individual pages on your site.
Getting to these reports is just the beginning. Understanding and using this data will help you make informed decisions to enhance your user’s website experience. So, let’s ensure that your website isn’t just a revolving door and keep those visitors exploring!
Interpreting Bounce Rate Data
Good bounce rates range between 26 and 70 percent, depending on the industry [1]. A lower percentage is preferable because it means that the content you’re creating on behalf of a brand or product resonates in some way with users. A bounce rate of 70 percent means that 70 percent of users navigated away from the page, while 30 percent stayed on the page and performed an action or moved to a second page. Similarly, a bounce rate of 48 percent shows that 48 percent of visitors navigated away, while 52 percent stayed on the page.
–coursera.org
You’ve probably discovered your site’s bounce rate by now, but what does this number tell you? At first glance, interpreting bounce rate data can seem straightforward: high is bad, and low is good, right? Well, it’s a bit more nuanced than that. Let’s dive into what these numbers say about your visitors’ behavior.
Analyzing what a high or low bounce rate indicates for your site
If you’re seeing a high bounce rate, it might be an alarm bell signaling that your content is not engaging or relevant to visitors or they didn’t find what they were looking for. On the other hand, a low bounce rate generally suggests that your site is doing a great job at captivation, keeping visitors interested enough to explore further.
Understanding how user behavior impacts bounce rate
It’s important to remember that user behavior significantly influences bounce rate. If a visitor lands on your page and finds what they need immediately (think ‘contact information’ on a ‘Contact Us’ page), they may be satisfied. It doesn’t necessarily signify a problem with your site.
- Quality of Content:
Do your pages provide valuable and relevant content? High-quality content keeps users on your page and can lead to lower bounce rates.
- Site Navigation:
If users find your site difficult to navigate, they will likely leave, hence a higher bounce rate.
- User Experience:
A site should be visually appealing and easy to interact with. Poor user experience can deter visitors from staying longer.
- Page Load Time:
Slow-loading pages can frustrate users and lead to increased bounce rates.
Call to Action: Clear calls to action can guide users to the next step, reducing the likelihood of bouncing.
In conclusion, while the bounce rate gives you a snapshot of visitor engagement, the context reveals the full picture. Assess your bounce rate about your site’s goals and visitor intent to understand what that number truly tells you. Keep it in context, and use it as a guide to refine your website strategy.
Pro Tip-Optimize your site’s content, navigation, and user experience to reduce bounce rates and enhance visitor engagement.
Average Bounce Rate by Industry: Setting Realistic Benchmarks
Are you wondering how your website compares to others in your industry? Understanding your sector’s average bounce rate can offer valuable context and help you set realistic performance targets. Each industry has unique visitor expectations and browsing behaviors, so comparing apples with apples is essential!
Industry Benchmarks for Bounce Rate
Let’s walk through some of the typical bounce rate benchmarks across various industries:
- Retail:
Often has a bounce rate of around 20-40%. Shoppers are looking to explore multiple products or are redirected from shopping ads.
- B2B:
You can experience 30-50% bounce rates as users hunt for specific information or solutions.
- Landing Pages:
With a single call-to-action, bounce rates can sometimes be higher than 70%-but that’s not always bad!
- Content Websites:
Based on relevancy and engagement, bounce rates can be 40-60%.
- Service Sites:
Similar to retail, could range from 10-30%, especially if services are detailed and aligned with user needs.
Setting Realistic Targets for Your Site’s Bounce Rate
Are you ready to determine a good bounce rate for your site? It’s not just about the numbers but what makes sense for your goals and how users engage with your content. The key is to analyze your unique Audience, understand what triggers their engagement, and continuously strive for improvements. Use industry benchmarks as a compass, but chart your course to success by tailoring your digital experience to match your visitors’ needs.
Pro Tip- Use industry benchmarks as a guide, but prioritize understanding your audience and tailoring your website’s experience to meet their needs, setting realistic performance targets based on user engagement rather than arbitrary standards.
Tips to Reduce Bounce Rate
Now that you know bounce rates and understand average industry standards, it’s time to take action. A high bounce rate isn’t just a number-it’s a signal that your website might not engage your visitors effectively. But worry not! We have some proven strategies to keep your users interested and reduce your site’s overall bounce rate.
Engagement-Boosting Strategies
- Improve User Experience:
A clean, attractive design and intuitive navigation will keep users on your site. Simplify your menus and ensure your layout is responsive for all devices.
- Relevant Content:
Deliver content that matches your users’ intent. Use clear, concise language and provide value immediately to captivate your Audience’s attention.
- Speed Up Your Site:
Page load time is crucial; the faster your site loads, the less likely users will bounce. Optimize images, leverage browser caching, and minimize HTTP requests to speed things up.
Content and Navigation Techniques
- Clear Call-to-Actions:
Guide your users on what to do next. Whether to read a related article or contact you, make it clear and easy to find.
- Internal Linking:
Keep readers engaged by linking to other relevant content within your site. It encourages exploration and increases the time they spend on your site.
- Content Layout:
Make your content easy to read with subheadings, bullet points, and short paragraphs. Break up text with images or videos to provide a dynamic content experience.
By applying these tips, you’ll be on your way to reducing your website’s bounce rate and boosting user engagement. Keep testing and tweaking-what works for one Audience might not work for another. Stay tuned into your Google Analytics data to monitor improvements and identify areas for further optimization.
Pro Tip- Continuously analyze user behavior using tools like Google Analytics and A/B and test different strategies to optimize user experience, content relevance, and site speed, ultimately reducing bounce rates and increasing engagement.
Unlock Deeper Insights with Data Segmentation in Google Analytics
Have you ever wondered if all your website visitors engage with your content similarly? Chances are, they’re not. That’s where the power of segmentation in Google Analytics comes into play. Using segmentation to gain more insights from your bounce rate data is like spotlighting different user groups’ specific behaviors and patterns. Instead of looking at a one-size-fits-all bounce rate, you can dissect that information and understand what it means for various audience segments. When you segment users, you can drill down into more specific data to help analyze trends. It can be anything from new visitors vs. returning visitors, mobile vs. desktop users, or different geographical locations. Doing so can tailor your website experience to suit different segments better, potentially lowering your bounce rate and boosting overall engagement.
- Understand how different audience segments interact with your website
- Identify which segments have a higher bounce rate and why
- Customize your content and site structure based on the needs of specific groups.
Segmentation is a powerful tool in Google Analytics that allows you to collect data and glean actionable insights from it. Understanding the importance of segmenting data opens the door to a more nuanced and effective analytics strategy. So, let’s dive deeper and use segmentation to get the most out of your bounce rate data!
Pro Tip-Use Google Analytics segmentation to analyze specific user groups’ behavior. This allows you to tailor your website content and structure to better meet their needs, ultimately reducing bounce rates and enhancing engagement.
Analyzing Page-Level Bounce Rate
When we dive deep into Google Analytics, assessing the bounce rate doesn’t stop at a surface-level understanding. Investigating how individual pages perform to optimize your user experience is crucial. By pinpointing which specific pages hold the highest bounce rates, we can unravel both problem areas and latent opportunities for strategic improvements.
Investigating bounce rate at the individual page level
Each page on your website has its unique role and potential impact on your visitor’s journey. To analyze the bounce rate for specific pages:
- Go to the Behavior section in Google Analytics.
- Click on Site Content, then select All Pages.
- Here, you’ll find a detailed report, including the bounce rate for every page.
Evaluate these numbers within the context of each page’s purpose. For instance, a high bounce rate on a contact page might not be alarming, while the same on a product page could signal an issue.
Identifying problematic pages and potential opportunities for optimization
Once you’ve identified pages with high bounce rates, it’s time to ask why. Consider these potential factors:
- Is the page load time causing visitors to leave?
- Are visitors not finding what they expected based on the page title or meta description?
- Could there be an issue with the page’s mobile responsiveness?
- Is the call-to-action clear, or are users left wondering what to do next?
Optimization opportunities can arise from improving user experience and content relevance or even decluttering the design to provide a clear pathway for users. These insights can tremendously lower bounce rates and boost user engagement.
Remember, a high bounce rate isn’t always bad, but understanding the nuances behind why users may be bouncing from specific pages is key to crafting effective strategies for improvement. So, let’s get those rates analyzed and start making data-driven decisions that will enhance your website’s performance!
Pro Tip-Dive into Google Analytics’ Behavior section to analyze individual page bounce rates, identifying optimization opportunities such as improving page load times, clarifying calls-to-action, and enhancing content relevance to reduce bounce rates and enhance user engagement.
Utilizing Events to Refine Bounce Rate
Have you ever wondered if your bounce rate tells the whole story? Let’s explore how events can sharpen that picture and give you a much clearer view of user engagement on your website.
Setting up Events in Google Analytics
Events in Google Analytics are user interactions that don’t correspond to a webpage loading, such as clicks on a button, video plays, or downloads. By setting these up, you’re tracking a broader spectrum of actions visitors take beyond just entering and exiting.
To set up events, you’ll need to:
- Decide what user interactions you want to track as events.
- Implement the necessary code snippets or set them up through Google Tag Manager.
- Verify that events are being recorded in your Google Analytics Events reports.
How Can Events Affect Bounce Rate Reporting and Interpretation?
Without events, Google Analytics defaults to viewing a single-page visit as a bounce. However, what if someone plays a video on that page, reads all the content, and then leaves? Technically, they’ve engaged, haven’t they?
By setting up events, you can adjust the definition of a bounce. For example, if a user plays a video, that action can be set up as an event, and their visit won’t count as a bounce. It can lead to a more accurate reflection of user engagement and a potentially lower, more accurate bounce rate.
Considering events in your bounce rate analysis is important, as it can change the narrative behind the numbers. With proper event tracking, you’re no longer just seeing who comes and goes; you’re understanding the quality of their visit.
Pro Tip-Enhance your bounce rate analysis by implementing events in Google Analytics to track user interactions beyond page loads, providing a more nuanced understanding of visitor engagement and potentially lowering bounce rates by accurately capturing user interactions.
Comparing Bounce Rate with Exit Rate
When delving into your site’s analytics, it’s crucial to understand the bounce rate and how it relates to the exit rate. While both metrics offer valuable insights, they provide different perspectives on user behavior. Let’s unravel the key differences and learn how to leverage this information for a more comprehensive analysis.
Understanding the Difference Between Bounce Rate and Exit Rate
At first glance, bounce rate and exit rate might seem similar, but they serve distinct purposes:
- Bounce Rate:
This metric represents the percentage of visitors who enter your site and then leave (“bounce”) without triggering any other requests to the analytics server during that session. In simpler terms, they look at one page and leave without interacting further.
- Exit Rate:
In contrast, exit rate is the percentage of exits from a page or set of pages. It measures how often users exit from that page after visiting any number of pages in a session. This metric doesn’t account for whether the user interacted with the page before leaving.
Assessing Both Metrics to Gain a Comprehensive View of User Behavior
Now that we’ve distinguished between the two, it’s time to use both metrics to get a fuller picture of user engagement. A high bounce rate could indicate that visitors didn’t find what they were looking for or that the page wasn’t engaging enough. Conversely, a high exit rate might not be as alarming-especially if it occurs on pages that naturally conclude a session, like a ‘Thank You’ or confirmation page.
By comparing bounce rate and exit rate, you can pinpoint pages that might be underperforming and start asking questions. Is the content on this page relevant to my Audience? Is there a clear call to action? Could I improve the user experience? Answering these questions could lead to changes that decrease bounce and exit rates and boost overall user satisfaction.
Remember that context is everything. Assess your analytics holistically to make informed decisions to improve your site’s performance.
Fine-Tuning User Engagement: Adjust the Time Threshold for Sessions in Google Analytics
We must recognize how session settings influence data interpretation as we delve deeper into Google Analytics’s intricacies. Understanding and adjusting the time threshold for sessions may appear technical, but it can be consequential in effectively capturing user engagement. Let’s explore how a small adjustment can make a big difference.
Modifying Session Settings to Better Capture User Engagement
By default, a session in Google Analytics lasts until 30 minutes of inactivity. But what if your content requires prolonged reading or interaction? Adjusting your session timeout can provide a more accurate picture. By extending the time threshold, you might find that what was once considered a ‘bounce’ could be a highly engaged user consuming your content.
Impact of Time Threshold Adjustments on Bounce Rate Calculations
Why does this matter? Bounce rate is calculated by single-page sessions divided by all sessions, or simply put, the percentage of sessions where users left your site from the entrance page without interacting with the page. If a visitor spends more than the default session time on a single page and leaves, it’s still considered a bounce. Adjusting the session duration could reduce your bounce rate as users spending longer on a page are acknowledged within a single session.
- For content-rich sites, consider lengthening the session timeout.
- For fast-paced websites, a shorter session might be more apt.
In essence, tuning the session thresholds enables Google Analytics to provide a clearer picture of engagement and helps you see beyond the conventional bounce rate metric. Now that you understand the significance of session adjustments in Google Analytics, you can make more informed decisions and refine your analysis of user engagement.
Pro Tip-Customize session duration thresholds in Google Analytics to better capture user engagement, adjusting for content complexity or site pacing. It can accurately represent visitor interaction and refine your analysis beyond traditional bounce rate metrics.
Ensuring Accuracy: Correct Tracking Code Implementation on Your Site
One fundamental step to accurately checking your bounce rate in Google Analytics is ensuring you’ve implemented the tracking code correctly. If your tracking code is misconfigured, it could lead to incorrect data collection, distorting your bounce rate and other important metrics. Let’s ensure your setup is flawless, avoiding common pitfalls that can skew your data.
Troubleshooting Common Installation Issues
Several common issues can occur while installing your Google Analytics tracking code. Here are some tips for troubleshooting to ensure your bounce rate data is precise and reliable:
- Check for Duplicate Tracking Codes:
Having the same tracking code installed multiple times on a single page can cause inflated traffic data and abnormal bounce rates. Use your browser’s ‘View Page Source’ feature to look for repeated Google Analytics script tags.
- Incorrect Placement of Tracking Code:
Your GA tracking code should typically be placed immediately before the closing tag. If placed incorrectly, it may not fire on every page load, leading to a lower reported bounce rate than actual.
- Compatibility with Website Platform:
Ensure the tracking code is compatible with your website platform. Certain content management systems (CMS) or website builders may require a specific integration method for the tracking code to work properly.
- Avoid Implementation on Redirect Pages:
Implementing tracking codes on redirect pages that instantly send users to a different page can result in a bounce being improperly attributed. Avoid placing tracking codes on such intermediary pages.
- Tag Manager Verification:
If you’re using Google Tag Manager to implement your tracking code, verify that your Google Analytics tracking tag is firing correctly with the ‘Preview and Debug’ mode.
You can trust that your Google Analytics data accurately reflects user behavior by meticulously following these steps and reviewing your tracking code’s health regularly. This foundational accuracy is essential for diagnosing bounce rate issues and making informed decisions to enhance your website’s user experience and performance.
Pro Tip-Ensure accurate bounce rate tracking in Google Analytics by checking for common installation issues, such as duplicate tracking codes, incorrect placement, platform compatibility, and avoiding redirects. Verify through Google Tag Manager for reliability.
Unlocking the Secrets of Bounce Rate with Google Analytics Reports
Once you’ve understood the bounce rate and set up Google Analytics on your site, it’s time to examine reports for more refined insights. Understanding the bounce rate in context is crucial, and Google Analytics offers a wealth of data for this purpose.
Navigating Through Reports to Find Actionable Data
Navigating your way through Google Analytics reports need not be a daunting task. With a few clicks, you can unearth actionable data to help you understand your bounce rate and its implications. Expertly identifying the areas where users bounce off your site most can inform strategic decisions and improvement initiatives.
Using Audience, Acquisition, Behavior, and Conversion Reports to Understand Bounce Rate
Each report within Google Analytics offers a unique perspective:
- Audience Reports:
These reports provide insights into who your visitors are, including demographics, interests, and behavior on your site. You can examine whether certain types of users are more likely to bounce than others and consider tailoring your content more effectively to your Audience’s preferences.
- Acquisition Reports:
Here, you’ll find out how users get to your site. It could be through search engines, social media, or referrals from other websites. By analyzing bounce rate in this context, you can pinpoint which channels bring traffic that sticks around and which don’t.
- Behavior Reports:
These reports highlight what users do on your site and show individual pages’ performance. Consider why specific pages might bounce higher due to poor content, slow load times, or unattractive calls to action.
- Conversion Reports:
Finally, conversion reports will illuminate how your bounce rate impacts your goals and conversions. They’ll help you discern whether a high bounce rate on a particular page also correlates with a drop in conversions, signaling a need for immediate optimization.
With a conversational partner by your side in Google Analytics, unravel the story behind your metrics and take the guesswork out of your next strategic moves!
Pro Tip-Navigate Google Analytics reports—Audience, Acquisition, Behavior, and Conversion—to gain insights into bounce rate trends. Analyze Audience to tailor content, Acquisition to optimize traffic sources, Behavior to enhance page performance, and Conversion to correlate bounce rate with conversions. Uncover actionable data to refine your strategy effectively.
Customize Your View: Google Analytics Dashboards
Believe it or not, your Google Analytics dashboard can be your best friend when monitoring key metrics like bounce rates. Thanks to the wonders of customization, you can tweak your dashboard to show you the bounce rate and a myriad of related insights that help you understand the ‘why’ behind the numbers.
Building Your Custom Dashboard
Creating a customized dashboard gives you immediate access to the most important metrics. Here’s how you can keep your finger on the pulse of your website’s bounce rate:
- Log in to Google Analytics and go to the ‘Dashboards’ section under ‘Customization.
- Click on ‘New Dashboard’ and select either a ‘Starter Dashboard’ (with pre-configured widgets) or a ‘Blank Canvas’ (to create your own).
- Add widgets focused on bounce rate and related metrics like ‘Pages/Session’ or ‘Avg. Session Duration. You can create widgets for specific segments, like mobile users or a particular traffic source.
- Use pie charts, line graphs, and tables to present the data in an easily digestible format.
Enhancing Team Collaboration
Don’t keep those insights to yourself! Here’s how you can share your ingenious dashboard setups with your team:
- Make it a team effort:
Invite your colleagues to view the customized dashboards you create.
- Regular updates:
Set up email reports from these dashboards to keep everyone in the loop.
- Accessibility:
Remember that shared dashboard configurations allow your team members to view the same data, fostering a collective understanding of website performance.
With these custom dashboards, you’re not just staring at numbers-you’re uncovering the story of your user experience and collaborating with your team to script a better one.
Bounce Rate vs. Engagement Metrics
Understanding your website’s bounce rate is just the tip of the iceberg when analyzing user engagement. While a high bounce rate might signal a concern, looking at this metric in the context of other engagement indicators, such as time on page and pages per session, is essential. These metrics collectively offer a richer, more nuanced picture of how users interact with your site.
Why Context Matters?
Think of bounce rate as a solo artist in a band. Sure, they can make some noise, but combining all instruments creates harmony. Similarly, time on page can indicate how long a visitor found your content engaging enough to stick around, and pages per session can reveal if they were interested enough to explore more of your site.
Creating a Concert of Metrics
We should avoid relying on a single metric to gauge site performance truly. Here’s how to use a combination of metrics for a more complete analysis:
- Bounce Rate:
Start with the bounce rate to identify how many users leave after viewing only one page.
- Time on Page:
Analyze the time users spend on your pages to assess content relevance and engagement.
- Pages per Session:
Measure the average number of pages a user visits during a session to understand their interest and navigation flow.
By examining these metrics together, you can pinpoint strengths and weaknesses in your content and site structure, enabling you to make informed decisions about where to allocate your improvement efforts.
Pro Tip-Combine bounce rate with time on page and pages per session metrics to comprehensively understand user engagement on your website. Analyzing these indicators together provides richer insights into content relevance, user interest, and site navigation flow, effectively guiding strategic improvements.
Actionable Steps After Analyzing Bounce Rate
Once you’ve done the hard work of analyzing your bounce rate, it’s time to take action! With your data ready, let’s roll up our sleeves and discuss transforming insights into tangible improvements for your website’s user engagement and performance. Below are some steps to put your analysis to practical use.
Identify Pages to Optimize
Start by pinpointing the pages with the highest bounce rates. These are the areas where you need to focus your optimization efforts first. Look at each page for potential issues that might be driving visitors away.
Improve Content Quality
Content is king and plays a pivotal role in keeping your visitors engaged. Assess whether the content on your high-bounce pages is relevant, valuable, and easy to digest. Update outdated information and ensure clarity and readability throughout.
Enhance User Experience
Polish the user experience (UX) by ensuring your site is easy to navigate. Check for broken links, simplify menus, and have clear calls-to-action (CTAs). An intuitive and frustration-free UX can significantly reduce your bounce rate.
Optimize Page Load Speed
Page load speed is a crucial factor influencing bounce rates. Use tools like Google’s PageSpeed Insights to identify and fix elements that slow down your site.
Analyze and Test
Remember to keep measuring the bounce rate after making changes based on your initial analysis. Different strategies, such as A/B testing different layouts or content, can show you what resonates best with your Audience.
Implement A Continuous Improvement Plan
Improving the bounce rate isn’t a one-off task; it’s an ongoing process. Create a plan with regular reviews and updates based on your analytics data. It will ensure your site remains engaging and meets your Audience’s evolving needs.
Wrapping Up: Understanding & Optimizing Bounce Rate
By now, you should have a strong grasp on how to check your bounce rate and what steps you can take to improve your site’s user engagement. Remember, your bounce rate is like a compass. It gives you direction but requires you to move towards improvement. Regular monitoring is key; it allows you to see the impact of the changes you make and get ahead of any issues that might arise.
Need help checking and reducing your website’s bounce rates? Contact the experts at Growth Natives for personalized assistance and curated solutions.
Email us at info@diggrowth.com to get started.
Citations
https://www.spcdn.org/support/glossary/bounce-rate
https://www.coursera.org/articles/what-is-bounce-rate
Ready to get started?
Increase your marketing ROI by 30% with custom dashboards & reports that present a clear picture of marketing effectiveness
Start Free Trial
Experience Premium Marketing Analytics At Budget-Friendly Pricing.

Learn how you can accurately measure return on marketing investment.

How Predictive AI Will Transform Paid Media Strategy in 2026
Paid media isn’t a channel game anymore, it’s a chessboard. Search, social, programmatic, video, influencer, native,...
Read full post post
Don’t Let AI Break Your Brand: What Every CMO Should Know
AI isn’t just another marketing tool. It’s changing how we connect with customers, personalize content, and...
Read full post post
From Demos to Deployment: Why MCP Is the Foundation of Agentic AI
A quiet revolution is unfolding in AI. And it’s not happening inside research labs. For decades,...
Read full post postFAQ's
Google Analytics is commonly used to check the bounce rate.
Bounce rate is calculated by dividing the number of single-page sessions by the total number of sessions.
In GA4, you can see the bounce rate under the Engagement section in the Analysis tab.
To check your bounce rate in Google Analytics, navigate to the Behavior section and select Overview.
A good bounce rate varies by industry but generally falls between 40% to 60%, although lower is often better.