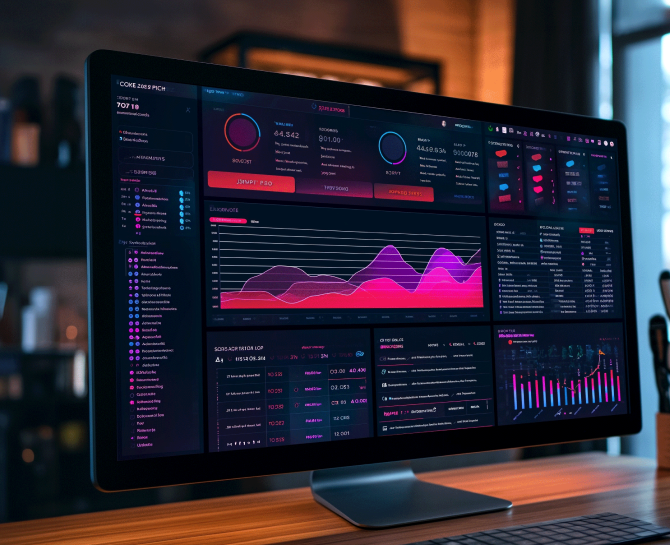
Business Dashboards: Your Gateway to Business Success
Business dashboards serve as invaluable tools for streamlining decision-making processes. Explore the intricacies of key performance indicators (KPIs), the meticulous selection of metrics tailored to your business objectives, and the profound influence of cloud computing on data accessibility and analysis. Read on.
Business dashboards are essential tools in the arsenal of modern business intelligence. They provide a visual representation of a company’s most critical data. By aggregating and distilling key performance indicators (KPIs) into an accessible, easy-to-digest format, these dashboards empower decision-makers to understand complex data at a glance, ensuring informed decisions can be made swiftly and confidently.
The significance of a business dashboard cannot be overstated, as it serves as the linchpin for companies aiming to streamline their analytics processes. Various business dashboards are tailored to meet diverse business needs, including operational, which offers real-time monitoring of day-to-day processes; strategic, which provides high-level views of long-term objectives; and analytical, which delves deep into data analysis for informed decision-making.
With specific applications in Sales, Customer Support, and Marketing, dashboards are versatile in facilitating effective strategies. Sales teams benefit from immediate insights into performance metrics, enabling agile responses to market changes. In Customer Support, dashboards offer a holistic view of customer interactions and service levels, delivering exceptional customer experiences. Meanwhile, Marketing professionals leverage dashboard data to measure campaign success and optimize strategies for greater impact. Harnessing the robust capabilities of business dashboards paves the way for enhanced efficiency and success across these crucial business domains.
Key Performance Indicators (KPIs) at a Glance
Key Performance Indicators, or KPIs, are quantifiable measures to evaluate an organization’s success in meeting its performance objectives. They are essential components of business dashboards, serving as vital signs that track departmental functions’ efficiency, progress, and overall health.
KPIs are the backbone of any effective business dashboard. They clearly show your company’s operational triumphs and challenges in real time, enabling quick decision-making and strategic planning. A business dashboard transforms into an insightful tool that aligns day-to-day operations with long-term goals by selecting relevant KPIs.
How to Select KPIs for Different Business Departments
Choosing the right KPIs is a tailored process and depends heavily on the specific goals of each department within an organization. It involves:
- Analyzing departmental objectives and aligning them with the company’s overall strategy.
- Selecting KPIs that are actionable and can be influenced by departmental efforts.
- Ensuring KPIs are clear, and measurable, and provide insights leading to actionable tasks.
Business Intelligence and Dashboards
Business Intelligence (BI) and business dashboards are intrinsically linked in the modern data-driven business landscape. A business dashboard visualizes of the most important metrics and data points, and BI is the engine behind extracting and analyzing this vast amount of data. Together, they empower organizations to make informed decisions swiftly.
The Relationship Between BI and Business Dashboards
Business dashboards are the culmination of a complex BI process. They translate the outcomes of data collection, mining, analysis, and processing into actionable insights presented via intuitive and interactive interfaces. The symbiotic relationship between BI and dashboards ensures that data isn’t just available, understandable, and accessible to decision-makers.
Using BI to Extract Meaningful Insights from Data
BI systems are the key to harnessing the true potential of business data. They utilize various algorithms and analytical procedures to uncover patterns, trends, and correlations. This lays the groundwork for predictive analytics and comprehensive reporting, driving the creation of dashboards that inform and suggest the next strategic moves.
Customize Your Business Dashboard with Precision Using Widgets
A business dashboard is indispensable for monitoring and analyzing your company’s performance. However, the effectiveness of any dashboard is significantly influenced by its tailorability to meet specific business needs. Here, we delve into the art of customization that transforms a standard dashboard into a powerhouse of actionable insights.
Understanding Customizable Widgets and Their Functionalities
Widgets are the building blocks of a personalized dashboard experience. Each widget is a gateway to a specific type of data or functionality, giving users a quick overview and access to the metrics that matter most. From chart widgets that visualize trends over time to task-related widgets that streamline operations, customization begins with a thorough understanding of each widget’s possibilities.
How Widgets Can Enhance Individual User Experience
Customization through widgets isn’t just about data display; it’s about optimizing the user experience. Personalized dashboards through selective widget deployment are crucial in providing relevant information tailored to individual roles within the organization. This minimizes the cognitive load and maximizes efficiency by reducing the time spent searching for vital data.
Tips for Choosing the Right Widgets for Your Dashboard
- Identify your KPIs
- Consider user roles:
- Balance simplicity and complexity:
- Prioritize interactivity:
- Ensure compatibility:
: Focus on widgets that provide insights into your primary performance indicators.
Different roles require different information. Tailor your selection to the needs of each user.
Aim for a clean, uncluttered interface without oversimplifying it to the point of omitting valuable data.
Choose widgets that allow users to interact with the data, such as filtering capabilities and drill-down functions.
Ensure the widgets integrate smoothly with your data sources and existing infrastructure.
Must-have Analytics and Reporting Tools
For any business dashboard to be effective, it requires a foundation of powerful analytics and reporting tools. These tools are not just add-ons but essential for mining actionable insights from vast data arrays. The right tools can transform raw data into a strategic asset, driving decision-making and fostering a data-driven culture within your organization.
Overview of Essential Tools for Robust Dashboards
The cornerstone of a high-functioning business dashboard is the analytics and reporting toolset that it employs. A myriad of options exists, but piecing together the right combination is critical. From real-time data processing to predictive analytics, your chosen tools should align with your company’s need for depth, flexibility, and scalability in data handling.
Features to Look for in Analytics and Reporting Tools
When evaluating your options, look for analytics and reporting tools that offer:
Comprehensive Data Integration: Ability to assimilate data from various sources, ensuring a holistic view of business performance.
- User-friendly Interface:
- Customizable Reporting:
- Advanced Analytics:
- Real-time Processing:
- Scalability:
- Collaboration Features:
- Security:
Tools should be accessible to users of varying skill levels, with intuitive navigation and clear visualization capabilities.
Flexibility to create tailored reports that align with specific business objectives and KPIs.
Beyond basic reporting, tools should offer advanced analytics features like predictive modeling and machine learning to unearth deeper insights.
The capability to process and report data in real-time, enabling immediate actionable insights and responsiveness.
Tools should grow with your business, handling increasing data volumes without compromising performance.
Facilitating shared access and collaborative analysis to democratize team data insights.
Robust security measures to protect sensitive data and comply with regulatory standards.
Designing User-Friendly Dashboards
Ensuring that your business dashboard not only serves its purpose in providing critical data but also delivers a stellar user experience is paramount. The intersection of UI (User Interface) and UX (User Experience) design principles is where truly intuitive and efficient dashboards come to life. Let’s delve into creating dashboards that users can navigate seamlessly and derive insights from without unnecessary complexity.
Principles of UI and UX Design for Dashboards
When we discuss UI and UX design, we focus on the dashboard’s overall look and usability. This encompasses simple yet elegant visuals that help users comprehend data easily and a logical layout that swiftly guides users through the most critical information.
Creating Intuitive Navigation and Layout for Users
Intuitive navigation is the backbone of a user-friendly dashboard. The goal is to minimize the learning curve so that users can begin interacting with the dashboard immediately. This involves a clear, hierarchical layout where the most important KPIs are front and center, with secondary data points accessible but not overwhelming the primary view.
Balancing Aesthetic Appeal with Functional Design
While aesthetic appeal is crucial in making the dashboard pleasing to the eye, it should not overshadow usability. A balance must be struck where design elements like color, spacing, and typography guide the eye and categorize information without becoming distractions. Functional design ensures that the beauty of the dashboard is matched by its practicality and ease of use.
Use colors strategically to highlight or differentiate key data points without confusing.
- Choose legible fonts and appropriate text sizes for readability on all devices.
- Employ whitespace effectively to prevent the dashboard from appearing cluttered.
- Ensure that interactive elements like buttons and dropdowns are easily identifiable and accessible.
Leveraging Cloud Computing for Dashboards
Cloud computing has transformed businesses, providing unparalleled scalability, cost efficiencies, and remote accessibility. Regarding business dashboards, leveraging cloud technology can significantly advance how data is managed and presented.
The Advantages of Cloud-Based Dashboards
Cloud-based dashboards offer many benefits over traditional on-premise solutions. They reduce the need for substantial upfront investments in hardware and allow organizations to pay as they go, often resulting in considerable cost savings. This subscription-based model allows businesses to adapt quickly to changing needs by adding or reducing capacity, making it easier to scale operations up or down.
Scalability, Cost-efficiency, and Remote Access Benefits
As organizations grow, their data grows with them. Cloud-based dashboards can swiftly scale to accommodate increased data loads without compromising performance, ensuring that decision-makers always have access to timely insights. Moreover, with the ability to access dashboards from anywhere at any time, remote teams can benefit from real-time data visualization and collaboration, which is especially relevant in today’s increasingly mobile and dispersed work environments.
Key Takeaways
- Simplify complex data and empower decision-makers with actionable intelligence.
- Custom widgets, seamless data integration, and industry-specific functionalities make dashboards indispensable for strategic decision-making.
- Meticulously structured dashboards enhance efficiency and productivity for businesses of all sizes.
- Embrace dashboards for enhanced performance and finely-tuned strategy execution in today’s competitive landscape.
Conclusion
Deploying tailored dashboards is crucial for optimizing organizational efficiency and productivity. In today’s data-driven landscape, leveraging sophisticated dashboards is a strategic imperative, empowering businesses with actionable insights for informed decision-making and agile strategy execution. To embark on this transformative journey, consider partnering with professionals to design bespoke dashboard solutions aligned with your unique business objectives.
Ready to get started?
Increase your marketing ROI by 30% with custom dashboards & reports that present a clear picture of marketing effectiveness
Start Free Trial
Experience Premium Marketing Analytics At Budget-Friendly Pricing.

Learn how you can accurately measure return on marketing investment.
Additional Resources
Don’t Let AI Break Your Brand: What Every CMO Should Know
AI isn’t just another marketing tool. It’s changing...
Read full post postFrom Demos to Deployment: Why MCP Is the Foundation of Agentic AI
A quiet revolution is unfolding in AI. And...
Read full post postAnswer Engine Optimization (AEO): The New Frontier of SEO in 2025
As digital experiences continue to evolve, so does...
Read full post postFAQ's
KPIs are quantifiable measures used to evaluate organizational success. They play a vital role in business dashboards by tracking departmental efficiency, aiding quick decision-making and strategic planning.
Choosing the appropriate KPIs involves aligning departmental objectives with the company's overall strategy. Selected KPIs should be actionable, measurable, and provide clear insights for informed decision-making.
Cloud computing offers scalability, cost efficiency, and remote accessibility. Cloud-based dashboards adapt to changing data loads, providing real-time insights from anywhere, aiding collaboration and decision-making.
 Rahul Sachdeva
  Arpit Srivastava

