
The Perfect Marketing Report Part II: 4 Things to Exclude
In the first part we covered things to include in your marketing report. This part focuses on things that should be excluded from your marketing report.
It can be overwhelming to leave out anything that you have data and insights on from your marketing report, so we are here to help you pick the rubies from the buckets full of rocks–not every shiny red stone is a ruby.
4 Things to Exclude in Your Marketing Report
- Buzzwords
- Metrics Not Tied To Organizational Goals
- Visuals That Don’t Add Value
- Data That Doesn’t Add Value
Buzzwords are just shiny red stones. Jargon adds no value to your report and, if anything, distracts from the point you are trying to make. Keep it simple and easy to understand. When you put your point across in an accessible way without embellishing it so much that its basic structure is unrecognizable, you allow the reader to understand the logic behind your points unencumbered by fancy buzzwords.
Like vanity metrics that don’t add any value, there are a ton of marketing metrics available to you. But just because you have them doesn’t mean you have to put them in the report. Just because you went through the trouble of carrying 3 buckets of rocks, it doesn’t necessarily mean that all those rocks are valuable. Yes, there are some rubies in there, precious ones too. But when you present them to a gems dealer among the other rocks that mean nothing, they will question your credibility in determining what is and isn’t valuable.
Sort the irrelevant metrics from the valuable information before you present your report. In fact, if you’re presenting specifically to a ruby expert and you happen to find some valuable emeralds, despite the value, leave them out too, and present only the rubies. Your organizational goals should determine what goes in your report and everything else that doesn’t match those goals should be left out.
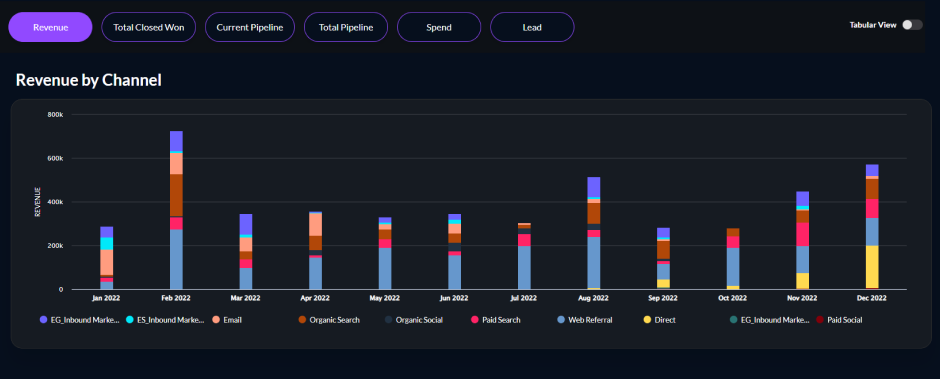
Keep your visuals simple so that they don’t end up confusing the viewer. As is the case with using complicated jargon and buzzwords, complicated visuals and graphs that are hard to interpret at the first look would distract whoever reads them. Instead, they will compel them to put more energy into either adjusting their eyes to jarring colors, tilting their head to read, or trying to understand the correlation between too many variables. This gets even worse if a graph they spend time to understand ends up being too obvious or irrelevant to the report. Don’t add visuals for the sake of visual appeal if they don’t actually add value to the point your report is trying to make.
A good report tells a story and gives clarity, so don’t add data that’ll end up confusing your viewers. Too much data is buckets full of rocks that can weigh heavily on a viewer’s mind. Pick only the most precious data that contributes to the report in value and insight. These rubies of information will enrich a report but can get lost if presented with rocks. Don’t feel compelled to add rocks of information just because you collected them. Leave out any data that lacks value
Planning and executing successful marketing campaigns
Before diving into creating your marketing campaign, it is essential to conduct thorough market research and analyze your target audience. This will help you align your campaign objectives with customer needs and preferences.
Once you have a clear understanding of your target market, you can develop a comprehensive marketing plan. This plan should outline the goals, strategies, tactics, and timelines for your campaign. It should also include a budget and allocation of resources.
Once your plan is in place, it is time to execute your campaign. This includes creating engaging content, designing eye-catching visuals, and selecting the appropriate channels to reach your target audience. A strong call to action and compelling messaging are also critical components to drive conversions.
Key elements of a marketing campaign
A well-executed marketing campaign consists of several key elements. First and foremost, it should have a clear and specific goal. Whether your objective is to increase brand awareness, generate leads, or drive sales, defining your goal will guide your decisions throughout the campaign.
Secondly, your campaign should have a defined target audience. Understanding the demographics, interests, and behaviors of your audience will allow you to tailor your messaging and select the most appropriate channels to reach them.
In addition, your campaign should have a consistent and compelling message that resonates with your target audience. This message should communicate the unique value proposition of your offering and address customer pain points.
Lastly, effective campaigns leverage multiple marketing channels to maximize reach and impact. This may include a combination of digital marketing tactics such as email marketing, social media advertising, content marketing, and SEO. It may also involve traditional marketing channels like print advertising or direct mail.
Measuring the effectiveness of marketing campaigns
Measuring the success of your marketing campaigns is crucial to understanding the return on your investment. Key performance indicators (KPIs) such as website traffic, conversion rates, and customer acquisition cost can provide valuable insights into the effectiveness of your campaigns.
Tools like Google Analytics and marketing automation platforms can help track and analyze these metrics. By regularly reviewing and analyzing the data, you can identify areas of improvement and make data-driven decisions to optimize your marketing campaigns.
It is also important to set benchmarks and compare your campaign’s performance against industry standards and previous campaigns. This will help you gauge the success of your efforts and identify areas where you may need to adjust your strategy.
In conclusion, marketing campaigns are essential for driving business growth and achieving your marketing objectives. By carefully planning, executing, and measuring the effectiveness of your campaigns, you can maximize their impact and drive results for your business.
Marketing Metrics
Tracking and analyzing marketing metrics is crucial for the success of any marketing campaign. By monitoring the right metrics, you can gain valuable insights into the effectiveness of your marketing efforts and make data-driven decisions to optimize your strategies. In this section, we will discuss the essential marketing metrics to track and analyze, how to choose the right metrics for your marketing objectives, and how to interpret these metrics for actionable insights.
Essential marketing metrics to track and analyze
When it comes to measuring the success of your marketing efforts, there are several key metrics that you should track and analyze. These metrics include:
- Conversion rate
- Customer acquisition cost (CAC)
- Customer lifetime value (CLTV)
- Website traffic
- Engagement rate
This metric measures the percentage of visitors who take a desired action, such as making a purchase, filling out a form, or subscribing to a newsletter. A higher conversion rate indicates that your marketing messages are resonating with your audience and driving them to take action.
CAC measures the average amount of money you spend to acquire a new customer. By tracking this metric, you can determine the profitability of your marketing campaigns and identify areas where you can reduce costs.
CLTV is the predicted net profit that a customer will generate over the course of their relationship with your business. This metric helps you determine the long-term value of each customer and allocate your marketing resources accordingly.
Monitoring your website traffic allows you to understand the volume and source of your website visitors. By analyzing this metric, you can identify which marketing channels drive the most traffic to your website and optimize your marketing strategies accordingly.
Engagement rate measures how actively your audience interacts with your marketing content, such as clicking on links, leaving comments, or sharing your posts. A high engagement rate indicates that your content is resonating with your audience and fostering meaningful connections.
How to choose the right metrics for your marketing objectives
Choosing the right metrics for your marketing objectives requires a thoughtful approach. Here are some key steps to help you select the most relevant metrics:
- Define your marketing objectives
- Identify the metrics that align with your objectives
- Consider industry benchmarks
- Regularly review and adjust your metrics
Clearly outline what you want to achieve with your marketing efforts. Whether it’s increasing brand awareness, generating leads, or driving sales, your objectives will guide your metric selection.
Look for metrics that directly measure the success of your marketing goals. For example, if lead generation is a priority, you may want to track metrics like lead conversion rate or cost per lead.
Research industry benchmarks to understand typical performance metrics for businesses in your sector. This will help you set realistic goals and benchmark your performance against competitors.
As your marketing campaigns evolve, it’s essential to regularly review and update your chosen metrics. This flexibility allows you to adapt to changing market conditions and ensure you are tracking metrics that align with your current objectives.
Also See
Interpreting marketing metrics for actionable insights
Interpreting your marketing metrics goes beyond simply monitoring the numbers. To gain actionable insights, consider the following approaches:
- Trend analysis
- Comparative analysis
- Segmentation analysis
- Cross-channel analysis/
Look for patterns and trends in your metrics over time. Are there any fluctuations or consistent changes? This can help you identify what factors are impacting your marketing performance and make necessary adjustments.
Compare your metrics against industry benchmarks or previous campaigns. This allows you to understand how your performance stacks up and identify areas for improvement.
Break down your metrics by different segments like demographics, geographic location, or customer segments. This will give you a deeper understanding of how different groups respond to your marketing efforts and enable you to tailor strategies accordingly.
Analyze how your metrics vary across different marketing channels. This will help you identify which channels are most effective in reaching your target audience and optimize your marketing mix.
By leveraging these methods of interpreting marketing metrics, you can gain actionable insights that will inform your marketing strategies and drive better results.
Importance of Data in Marketing Reports
When it comes to making informed marketing decisions, data plays a crucial role. By understanding the role of data in marketing decision-making, businesses can unlock valuable insights and drive their strategies towards success.
Understanding the Role of Data in Marketing Decision-Making
Data provides businesses with the necessary information to evaluate their marketing efforts and make data-driven decisions. By analyzing data, marketers can identify patterns, trends, and customer behaviors, enabling them to tailor their strategies accordingly.
For example, data can reveal which marketing campaigns are driving the most engagement and conversions, allowing marketers to allocate their budget more effectively. It can also provide insights into customer preferences, enabling businesses to personalize their content and offers, thus improving customer satisfaction.
How Data-Driven Insights Can Improve Marketing Strategies
By leveraging data-driven insights, marketers can refine their strategies and optimize their marketing efforts. Analyzing data allows businesses to determine which strategies are working and which need improvement, leading to more effective and efficient marketing campaigns.
Furthermore, data helps marketers understand their target audience better. By analyzing customer demographics, behaviors, and preferences, businesses can create highly targeted and personalized marketing messages that resonate with their audience, ultimately increasing engagement and conversion rates.
Benefits of Including Accurate and Relevant Data in Marketing Reports
Accurate and relevant data is vital in marketing reports as it provides businesses with a clear understanding of their marketing performance. Including data in reports helps measure the success of marketing campaigns, identify areas for improvement, and benchmark against competitors.
Moreover, data in marketing reports enables businesses to demonstrate the effectiveness of their strategies to stakeholders. By presenting concrete data and metrics, marketers can showcase the return on investment and the impact of their marketing efforts, strengthening their credibility and justifying budget allocations.
Creating an Official Website Page for the Exclude Marketing Report
When it comes to showcasing the Exclude Marketing Report, having an official website page dedicated to it is crucial. This page will not only provide valuable information to your audience but also serve as a central hub for accessing the report. So, let’s dive into how you can create an attention-grabbing webpage for the Exclude Marketing Report.
Steps to create a dedicated webpage for the report
Start by selecting a template or designing a custom layout for the page. Ensure that the design aligns with your brand’s visual identity and enhances the user experience.
Choose an appropriate URL for the webpage, ideally including keywords related to the report. For example, www.yourwebsite.com/exclude-marketing-report.
Craft a compelling headline and subheadings that pique the reader’s curiosity and clearly convey the purpose of the report.
Incorporate engaging visuals such as images, infographics, or videos to break up the text and make the page visually appealing.
Present an executive summary or overview of the report’s key findings and benefits to entice visitors to download or access the full report.
Add a form or call-to-action (CTA) button that allows visitors to easily download or request the report. Collect relevant information from users, such as their name, email address, and organization, to build your marketing database.
Designing the page to highlight key features and benefits
Make the page visually appealing by using eye-catching colors, fonts, and formatting to highlight important information relating to the Exclude Marketing Report. Utilize strong tags (like <strong>) when necessary to emphasize key points. Consider creating bullet points or a numbered list to summarize the distinguishing features and benefits of the report.
Strategies for driving traffic to the page and generating engagement
Leverage your existing marketing channels, such as social media platforms, email newsletters, and blog posts, to promote the launch of the dedicated webpage.
Create compelling and shareable content related to the report, such as blog articles, infographics, or videos. Include links to the dedicated webpage within this content to drive traffic back to the page.
Consider running paid advertising campaigns on search engines and social media platforms to increase visibility and generate targeted traffic to the webpage.
Encourage visitors to share the webpage with their networks by adding social sharing buttons. This will help increase organic reach and engagement.
Monitor the performance of the webpage using analytics tools to identify opportunities for improvement. Optimize the page based on user behavior and feedback.
By following these steps and implementing effective strategies, you can create a captivating official website page for the Exclude Marketing Report. This dedicated webpage will not only showcase the report’s value but also drive engagement, generate leads, and establish your brand as an authority in the marketing industry.
Leveraging HubSpot for Marketing Report Distribution
HubSpot is a powerful marketing automation tool that can greatly enhance your marketing report distribution efforts. Here are some advantages of using HubSpot for this purpose:
Advantages of using HubSpot as a marketing automation tool
- Automated report distribution
- Personalized content
- Integration with other marketing tools
- Lead nurturing
HubSpot allows you to automate the distribution of your marketing reports, saving you valuable time and effort.
With HubSpot’s personalization features, you can tailor your reports to each recipient, making them more relevant and engaging.
HubSpot integrates seamlessly with other marketing tools, enabling you to streamline your marketing processes and improve efficiency.
HubSpot’s lead nurturing capabilities enable you to send targeted content to your prospects based on their interactions, increasing the chances of conversion.
Leveraging HubSpot’s email marketing feature for report distribution
One of HubSpot’s standout features is its robust email marketing functionality, which can greatly facilitate the distribution of your marketing reports. Here’s how you can leverage this feature:
- Segment your email list
- Create visually appealing emails
- Automate email sends
HubSpot allows you to segment your contacts based on various criteria, such as industry, job title, or engagement level. This segmentation enables you to send tailored reports to specific groups, increasing the relevance and impact of your communications.
With HubSpot’s drag-and-drop email editor, you can easily create visually stunning emails that will capture your recipients’ attention. Add images, videos, and interactive elements to make your reports more engaging.
HubSpot’s automation capabilities enable you to schedule automated email sends, ensuring that your reports reach your audience at the right time. You can also set up email workflows to nurture leads and guide recipients through the sales funnel.
Tracking and analyzing email performance to optimize engagement
HubSpot provides comprehensive analytics and reporting features that allow you to track and analyze the performance of your email campaigns. By monitoring key metrics such as open rates, click-through rates, and conversion rates, you can gain valuable insights into the effectiveness of your marketing report distribution efforts. Use this data to make data-driven decisions and continuously optimize your email strategy to maximize engagement and results.
Monitoring Marketing Activity and Performance
Tracking and analyzing marketing activities is crucial to determine the effectiveness of your strategies and optimize future campaigns. By monitoring your marketing performance, you can identify what’s working and what’s not, allowing you to make data-driven decisions for improvement.
Strategies for monitoring marketing activities and performance
- Set clear marketing objectives
- Establish key performance indicators (KPIs)
- Implement marketing tracking tools
- Monitor social media engagement
- Collect customer feedback
Before monitoring your marketing activities, define specific and measurable goals. This will help you track your progress accurately.
KPIs are essential metrics that measure the success of your marketing efforts. Determine which metrics align with your objectives and regularly track them.
Utilize tools like Google Analytics to monitor website traffic, conversions, and user behavior. These tools provide valuable insights into your marketing performance.
Keep an eye on your social media platforms to measure engagement, reach, and sentiment. This data can help you gauge the effectiveness of your social media marketing.
Gather feedback from your customers through surveys or feedback forms. This will provide insights into customer satisfaction and help you improve your marketing strategies.
Tools and techniques for gathering relevant Marketing Data
Marketing automation software: Implement marketing automation tools like HubSpot to streamline data collection. These tools can track customer behavior, campaign performance, and lead generation.
- Customer relationship management (CRM) systems
- Email marketing platforms
- Social media analytics
- Website analytics
Integrate your marketing efforts with CRM systems to gather customer data, track interactions, and analyze customer journeys.
Analyze email open rates, click-through rates, and conversion rates using email marketing platforms. This data helps you understand the impact of your email campaigns.
Social media platforms provide built-in analytics that offer valuable data on audience demographics, engagement, and reach. Leverage these insights to refine your social media marketing strategies.
Utilize website analytics tools, such as Google Analytics, to track website performance, traffic sources, and user behavior. This data helps you optimize your website and marketing strategies.
Utilizing performance data to optimize marketing strategies
Once you’ve gathered relevant marketing data, it’s crucial to analyze and apply those insights to optimize your marketing strategies:
- Identify trends and patterns
- Make data-driven decisions
- A/B testing
- Continuous optimization
- Recap of the importance of excluding irrelevant data from marketing reports
Analyze the data to identify trends and patterns that indicate what marketing strategies are working and what needs improvement.
Use the data to make informed decisions about allocating budgets, adjusting campaigns, and refining targeting strategies.
Conduct A/B tests to compare different marketing approaches and determine which variant yields better results. This experimentation allows you to refine your strategies based on data-driven insights.
Regularly review your marketing data and make necessary adjustments to optimize performance. This iterative process ensures ongoing improvement of your marketing strategies.
Excluding irrelevant data from marketing reports is crucial in order to maintain accuracy and focus.
By excluding irrelevant data, marketers can avoid confusion and ensure that their reports are concise and actionable.
Irrelevant data can mislead decision-makers and hinder the effectiveness of marketing strategies.
Excluding irrelevant data allows marketers to highlight the most impactful insights and trends.
Key takeaways for creating accurate and actionable marketing reports:
Identify the specific goals and objectives of the marketing report to determine what data is relevant.
Regularly review and update the criteria used to exclude irrelevant data.
Utilize reliable and comprehensive data sources to ensure the accuracy of the included data.
Consider the audience of the marketing report and tailor the information accordingly.
Encouragement to utilize the outlined topics and strategies for successful marketing efforts:
By implementing the strategies and topics discussed in this report, marketers can:
Improve the accuracy and effectiveness of their marketing campaigns.
Optimize their marketing strategies based on reliable data and insights.
Increase the likelihood of achieving their marketing goals and objectives.
Enhance their marketing reports by excluding irrelevant data and focusing on actionable insights.
In conclusion, excluding irrelevant data from marketing reports is essential for accurate and actionable insights. By following the key takeaways and implementing the strategies discussed, marketers can improve their overall marketing efforts and achieve greater success.
Summing Up
Anything that doesn’t add value to a report should be left out, whether buzzwords and fancy graphs or irrelevant metrics and data. However, it isn’t always easy to tell a shiny red rock from a precious ruby, which is why it is prudent to leave the careful sieving to machines that will not make mistakes. AI can sort relevant from irrelevant data and make your marketing reports for you with no ruby left behind and no rocks included.
DiGGrowth—an AI-driven no-code marketing intelligence platform—gives you the ability to justify your marketing spend by demonstrating the ROI of your marketing activities. Know how DiGGrowth can help you automate and generate custom marketing reports.
Ready to get started?
Increase your marketing ROI by 30% with custom dashboards & reports that present a clear picture of marketing effectiveness
Start Free Trial
Experience Premium Marketing Analytics At Budget-Friendly Pricing.

Learn how you can accurately measure return on marketing investment.
Additional Resources

How Predictive AI Will Transform Paid Media Strategy in 2026
Paid media isn’t a channel game anymore, it’s a chessboard. Search, social, programmatic, video, influencer, native,...
Read full post post
Don’t Let AI Break Your Brand: What Every CMO Should Know
AI isn’t just another marketing tool. It’s changing how we connect with customers, personalize content, and...
Read full post post
From Demos to Deployment: Why MCP Is the Foundation of Agentic AI
A quiet revolution is unfolding in AI. And it’s not happening inside research labs. For decades,...
Read full post postFrequently Asked Questions
Some things that should be excluded from a marketing report are buzzwords, metrics not tied to organizational goals, visuals that don't add value, and data that doesn't add value.
Buzzwords should be excluded from a marketing report because they add no value and can distract from the main point. Keeping the report simple and easy to understand allows the reader to grasp the logic behind the points without being burdened by unnecessary jargon.
Excluding metrics not tied to organizational goals is important because including irrelevant metrics can raise questions about the credibility of the report. It is crucial to sort out the relevant metrics that align with the goals of the organization to provide meaningful insights and maintain the report's focus.
Excluding visuals that don't add value is significant because complicated or irrelevant visuals can confuse the viewer and distract them from the report's message. Simple and relevant visuals ensure clarity and understanding, allowing the viewer to focus on the key information being presented.
Leaving out data that doesn't add value is important to maintain a clear and concise report. Including excessive or irrelevant data can overwhelm the viewer and detract from the main insights. Selecting only the most valuable and insightful data enhances the report's storytelling and ensures the information is meaningful to the audience.