
Data-Driven Decisions: Transform Business with Analytical Reports
For decision-makers in today's complex business environment, clarity is essential. However, amidst vast data sets, finding actionable insights can be daunting. Analytical reports serve as reliable guides, simplifying complex data into practical guidance. This blog explores why decision-makers trust analytical reports and their transformative potential in strategic planning.
Analytical report examples are structured documents that transform raw data into actionable insights, helping businesses make data-driven decisions with confidence. This blog explores how these reports work, key components that enhance clarity, and real-world applications that drive strategic success. By the end, you’ll understand how leveraging analytical reports, often built on insights from Market research, can eliminate guesswork and optimize your decision-making process.
There’s a better way. Enter the powerful world of analytical reports. These reports, when combined with thorough market research, transform raw data into a clear, compelling story. They reveal hidden trends, illuminate customer behavior, and ultimately guide you toward data-driven decisions that propel your business forward. This blog post will equip you to harness the transformative power of analytical reports. We’ll explore real-world examples that showcase how data visualization, insightful analysis, and market research can turn guesswork into confident decision-making.
Key Takeaways
- Analytical report examples help businesses transform raw data into actionable insights, driving smarter decision-making and growth.
- A well-structured analytical report includes key components like objectives, data visualizations, and insights, ensuring clarity and impact.
- Using the right tools—such as DiGGrowth for marketing analytics, Microsoft Excel, and Tableau—streamlines data analysis and improves accuracy.
Why do Analytical Reports Matter?
Analytical reports are designed to dissect complex data sets to uncover underlying patterns, relationships, and trends. This reporting form converts raw data into actionable insights, allowing decision-makers to tackle problems strategically. By leveraging the power of these insights, organizations can streamline operations, optimize performance, and foster continuous growth.
Analytical reports translate data into a language strategists can use to craft targeted initiatives, allocate resources efficiently, and predict market behavior. By incorporating Consumer insights and applying techniques like Factor analysis, companies can uncover hidden patterns in the data. Companies that embrace data analytics gain a considerable edge by identifying opportunities and threats ahead of the curve, thus achieving a sustainable advantage over their competitors.
Crafting the Perfect Analytical Report: Structure and Components
Analytical reports are a foundational element in decision-making processes for businesses of all sizes. A well-structured report not only conveys data and analysis effectively but also guides readers to understand the implications of that information for project planning and customer retention strategies. Consequently, understanding the structure and components of an exemplary analytical report is vital.
Overview of the Typical Structure of an Analytical Report
Understanding the intricate composition of an exemplary analytical report reveals a meticulously crafted blueprint designed to transform raw data into actionable insights seamlessly. This process involves careful application of a robust Data model and aligns with principles of Strategic management, ensuring that the insights drive informed decision-making and long-term success.
Deconstructing Essential Components
Each facet assumes a critical role in shaping the report’s narrative:
- Executive Summary:
- Contextual Establishment:
- Methodological Framework:
- Data Presentation:
- Comprehensive Analysis:
- Conclusive Summary:
- Actionable Recommendations:
This section concisely distills key findings and recommendations, providing busy executives with a succinct overview and enabling quick comprehension of pivotal insights.
The report begins with clearly delineating objectives and contextual parameters, setting the stage for a thorough understanding of its purpose and scope.
A detailed exposition of the methodologies and approaches utilized for data collection and analysis ensures transparency and reproducibility, fostering credibility and trust.
Raw data is methodically organized and presented using structured tables or visual aids, facilitating ease of interpretation and analysis for stakeholders.
The report uncovers underlying patterns, correlations, and insights, giving stakeholders a nuanced understanding of the subject matter.
This section summarizes the findings and their implications, distilling the essence of the analysis and guiding decision-makers toward informed actions.
Drawing upon the insights gleaned, the report offers practical and actionable recommendations to drive strategic decision-making and facilitate positive outcomes.
Navigating the Transition from Data to Insight
The journey from raw data to actionable insights is characterized by meticulous scrutiny and interpretation:
- Data Presentation:
- Thorough Analysis:
- Insightful Interpretation:
- Strategic Guidance:
Factual data is structured, transforming into meaningful information as the foundation for insightful analysis.
Leveraging analytical tools and methodologies, the report dissects the data to unearth valuable insights, shedding light on trends, anomalies, and correlations.
By contextualizing the findings within the broader framework of the subject matter, the report elucidates the significance of the data, empowering stakeholders to make informed decisions.
Armed with actionable insights, stakeholders are equipped to formulate strategies and initiatives that drive organizational growth and success.
Harness the Power of Data with Analytical Reports
The real-world examples we explored showcase the transformative potential of analytical reports. By unlocking valuable insights from data, businesses can increase Awareness, can make informed decisions, optimize processes, and achieve remarkable results.
But how do you get started with leveraging this powerful tool? Here’s a practical guide to equip you for crafting effective analytical reports and putting data to work for your business:
Define Your Goals: Charting the Course
The first step is to identify the specific goals you want to achieve with your analytical report. Are you looking to:
- Optimize marketing campaigns:
Understand your target audience and measure campaign effectiveness.
- Boost sales performance:
Identify trends, analyze sales team performance, and improve conversion rates.
- Enhance website user experience:
Uncover user behavior patterns and improve website usability.
Data Collection: Gathering the Raw Materials
Once you have your goals in mind, it’s time to gather the raw materials – your data! This might involve accessing information from various sources, such as:
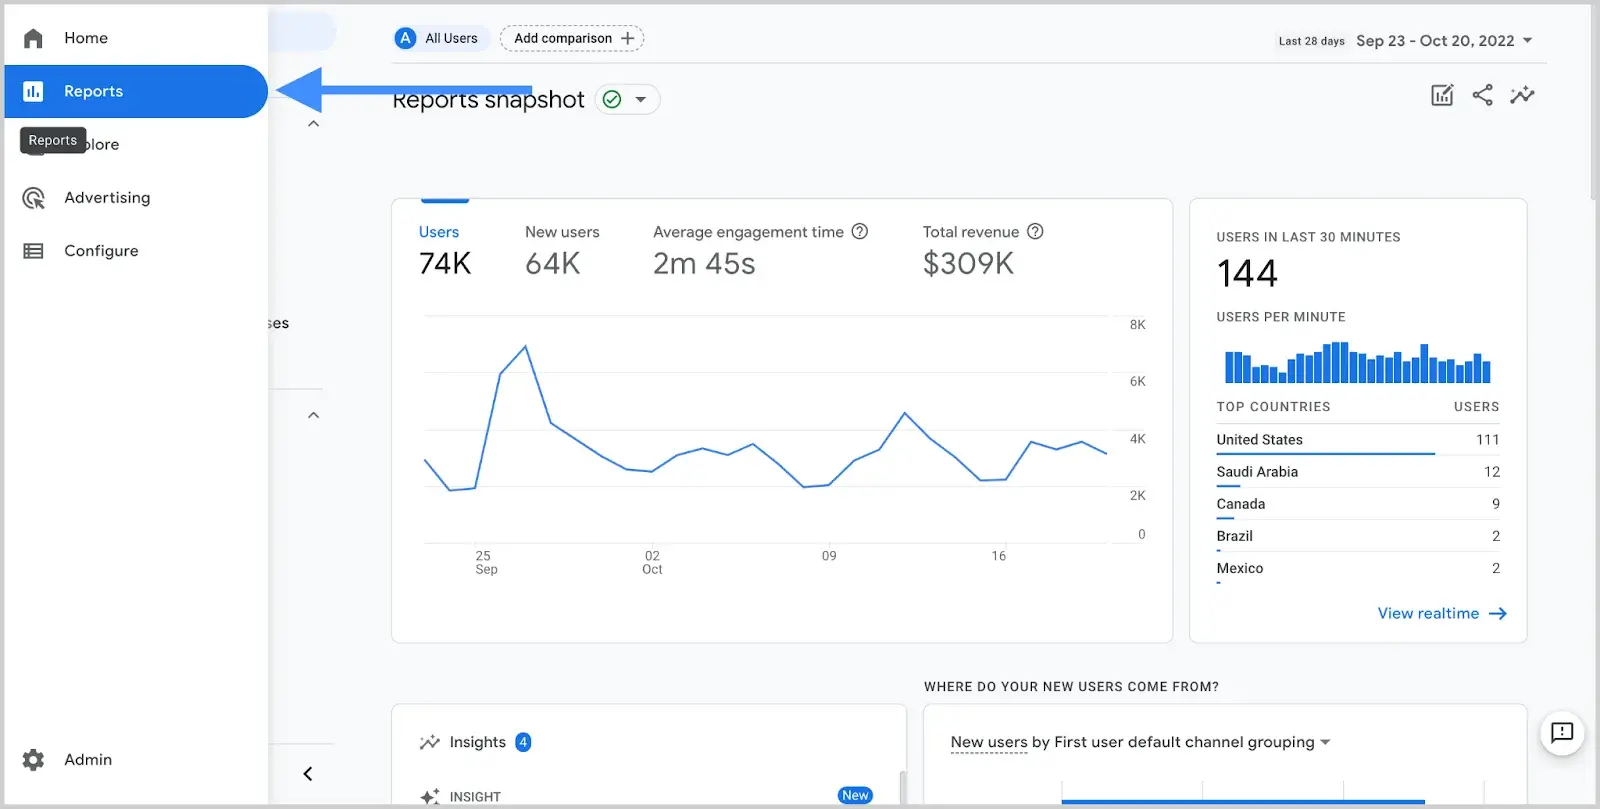
- Website analytics:
Track user behavior on your website to understand customer journeys and identify areas for improvement.
- CRM systems:
Analyze customer data to understand buying patterns and personalize marketing efforts.
- Social media analytics:
Gain insights into audience demographics and engagement with your social media content.
- Financial data:
Analyze sales figures, costs, and profitability to make informed financial decisions.
Best Practices for Research and Methodology in Analytical Reports
An analytical report’s strength lies in its research and methodology. Properly executed, these components not only bolster the credibility of the findings but also ensure that conclusions are logically sound and actionable for strategic management.
Developing Evidence-Based Recommendations
- Maintain objectivity:
Guard against biases that may color the research and lead to skewed conclusions.
- Establish a robust methodology:
A systematic research approach enables repeatability and credibility in the findings.
- Use qualitative and quantitative methods:
Combining these methods can provide a more complete view and deepen the insights gained.
Industry Insights: Analytical Reports Across the Spectrum
Every industry thrives on well-informed decisions. An essential tool driving these decisions is the analytical report. These reports offer a powerful snapshot, providing stakeholders with clarity, insights, and action points. Examples of Analytical Reports in Different Industries
- Business:
Analytical reports can pinpoint market trends, assess financial health, and strategize marketing efforts. They are pivotal for strategy development and operational optimization.
- Science:
Scientific analytical reports dissect experimental data and research findings. They are crucial in validating hypotheses, publishing findings, and guiding future research directions.
- Education:
Educational institutions employ analytical reports to analyze student performance, curriculum effectiveness, and institutional growth. These insights propel improvements in teaching methodologies and student services.
Technological Aids in Analytical Reporting
Advanced software and innovative tools have revolutionized the way we create analytical reports. In the digital age, technological aids can significantly reduce the time and effort required to analyze large datasets extract valuable Customer insight, and generate comprehensive reports to inform strategic decisions.
Software and Tools for Analytical Reporting
There is a myriad of software solutions designed to assist with analytical reporting. These tools range from simple spreadsheet applications to complex data analysis software, which can quickly process vast amounts of information, uncover patterns, and present findings in clear, digestible formats. Ensuring data quality is crucial in this process, as accurate and reliable data forms the backbone of any analysis.
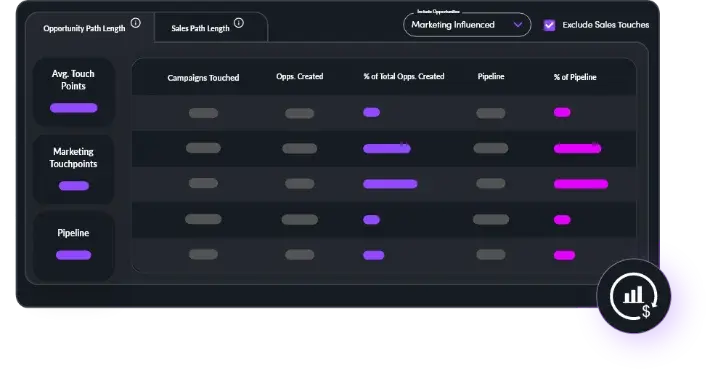
- DiGGrowth:
- Microsoft Excel:
- Google Sheets:
- Tableau:
- Power BI:
- R and Python:
- SAS:
DiGGrowth is positioned as a game-changer in marketing analytics, accurately measuring revenue impact from marketing activities. It integrates data science principles to offer features such as precise marketing analytics and attribution while seamlessly tracking, integrating, and consolidating the customer journey for optimized marketing strategies. DiGGrowth provides comprehensive dashboards and reports tailored to specific roles and objectives, aiding in informed decision-making and driving higher revenue from marketing initiatives.
Microsoft Excel is a widely used spreadsheet application that offers basic analytical capabilities for organizing, manipulating, and analyzing data. It provides features such as formulas, pivot tables, and charts, making it suitable for various analytical tasks, from simple data entry to complex calculations.
Google Sheets is a cloud-based spreadsheet application similar to Microsoft Excel. It offers basic analytical functionalities, including formulas, data visualization tools, and collaboration features, allowing multiple users to work on the same spreadsheet simultaneously. Google Sheets is accessible from any device with an internet connection, making it convenient for remote collaboration.
Tableau is a powerful data visualization tool that enables users to create interactive dashboards and visualizations for in-depth analysis. It offers a user-friendly interface with drag-and-drop functionality, allowing users to explore data visually and uncover insights quickly. Tableau supports various data sources and integrates seamlessly with other analytical tools, making it suitable for individual analysts and large-scale enterprise deployments.
Microsoft’s business analytics tool empowers users to create interactive reports and dashboards for data visualization and analysis. It offers a wide range of data connectors, allowing users to connect to multiple data sources and combine data for comprehensive analysis. Power BI also provides advanced features such as natural language querying and AI-powered insights, making it suitable for business users and data professionals. Additionally, it supports businesses operating on a subscription business model by offering tools to track key metrics such as customer acquisition and retention, and raise awareness of trends and patterns that are critical for growth.
R and Python are programming languages commonly used for data analysis and statistical computing. Both languages offer extensive libraries and packages for various analytical tasks, including data manipulation, visualization, and machine learning. R is particularly popular among statisticians and data scientists. Python is widely used in both data analysis and software development.
SAS is a comprehensive analytics platform with advanced statistical analysis, data mining, and predictive modeling capabilities. It offers a wide range of tools and solutions for data management, analysis, and visualization, making it suitable for businesses of all sizes and industries. SAS is particularly popular in healthcare, finance, and government industries, where data security and compliance are critical.
Pro Tip- Utilizing the right technology in analytical reporting streamlines the process and enhances accuracy. Automation features can handle repetitive tasks, data aggregation, and sorting, allowing analysts to focus on interpreting the results and crafting actionable insights that ultimately drive Customer satisfaction through more tailored and effective strategies.
Case Study: How DiGGrowth Revolutionized Marketing Strategies for a Leading Fitness Company
Introduction
Staying ahead of the competition requires innovative approaches to marketing and customer engagement. For one renowned fitness company, this challenge became an opportunity for transformation by implementing DiGGrowth, a cutting-edge analytics platform designed to optimize marketing strategies.
Background
With a diverse product range spanning gym equipment, apparel, and digital fitness programs, the fitness company faced the common dilemma of effectively reaching and resonating with its target audience. Despite substantial investments in traditional marketing channels, such as print and television commercials, it struggled to achieve desired engagement and conversion rates.
Challenges
- Limited insights into customer preferences and behavior.
- Inefficient allocation of marketing resources across various channels.
- I need help identifying and targeting niche audience segments effectively.
Solution
Recognizing the need for data-driven decision-making, the fitness company partnered with DiGGrowth to implement a comprehensive analytics solution. DiGGrowth provided actionable insights to enhance every aspect of the company’s marketing strategy by leveraging advanced algorithms and machine learning capabilities.
Implementation
- Data Integration:
DiGGrowth seamlessly integrated with the company’s existing systems, aggregating data from multiple sources, including website analytics, social media platforms, and customer databases.
- Audience Segmentation:
Utilizing sophisticated segmentation algorithms, DiGGrowth identified distinct audience segments based on demographics, behavior, and preferences. This allowed for highly targeted marketing campaigns tailored to specific customer personas.
- Campaign Optimization:
DiGGrowth analyzed the performance of ongoing marketing campaigns in real-time, identifying underperforming channels and optimizing ad spend allocation accordingly. A|B testing methodologies were employed to refine messaging and creative elements for maximum impact.
Results
- Increased Engagement:
By targeting niche audience segments with personalized messaging, the fitness company witnessed a significant increase in customer engagement across all marketing channels.
- Improved Conversion Rates:
Continuous optimization guided by DiGGrowth insights soared conversion rates, resulting in a notable uptick in sales of gym equipment, apparel, and digital fitness programs.
- Enhanced ROI:
By allocating marketing resources more efficiently and taking a laser-focused approach to audience targeting, the company achieved a higher return on investment (ROI) for its marketing initiatives.
Conclusion
In a highly competitive industry where differentiation is key, the partnership between the renowned fitness company and DiGGrowth proved to be a game-changer. By harnessing the power of data-driven insights, the company not only transformed its marketing strategies but also solidified its position as a leader in the fitness market. With DiGGrowth as a trusted ally, the company continues to innovate and thrive in an ever-evolving landscape.
Real-World Examples of Analytical Reports in Action
We’ve seen how analytical reports transform raw data into a powerful tool for data-driven decision-making. Now, let’s see how the real world and witness the transformative impact of these reports in action. Here are a few examples of how businesses across various industries have leveraged analytical reports to achieve remarkable results:
Marketing Campaign Optimization
Imagine a clothing company launching a new activewear line. They invest heavily in a marketing campaign targeting a broad audience of fitness enthusiasts. However, initial sales figures fall short of expectations. Here’s where the power of analytical reports comes in.
The marketing team generates a report analyzing website traffic, social media engagement, and customer demographics. The report reveals a surprising truth—the campaign’s most engaged audience segment wasn’t young fitness enthusiasts but middle-aged women interested in comfortable clothing for everyday wear.
Armed with this crucial insight, the marketing team refocuses the campaign. They tailor their messaging and visuals to target the newly identified audience segment. Social media ads showcase the activewear line’s comfort and versatility for everyday activities, and website content highlights the clothing’s practicality and style.
The result? Sales of the activewear line soar, exceeding initial projections. This example showcases how analytical reports can expose hidden trends and demographics, allowing for targeted adjustments that maximize campaign effectiveness.
Sales Team Performance Analysis
Let’s shift gears to a software company experiencing stagnant sales growth in a specific region. The sales manager suspects uneven performance across the sales team might be hindering overall results. An analytical report is generated, analyzing individual sales figures, call recordings, and customer interaction data.
The report unveils a clear pattern—some salespeople consistently exceed quotas, while others struggle to convert leads. Further analysis reveals that top performers focus on specific product features valued by customers in that region.
Equipped with this data-driven insight, the sales manager creates a targeted training program. They share the sales strategies of top performers and equip the underperforming team members with the knowledge and skills required to address regional customer preferences.
Following the training program, sales figures in the region begin to climb steadily. This example demonstrates how analytical reports can identify performance gaps within a team, leading to targeted training and improved sales performance.
Website User Experience Improvement
Finally, consider an e-commerce website experiencing high bounce and low conversion rates. The website owner suspects the user experience (UX) might hinder customer engagement. To investigate, the website team generates an analytical report analyzing user behavior data.
The report unveils a user flow issue: Customers abandoned their shopping carts midway through the checkout process. Further analysis revealed a cumbersome and confusing checkout form.
Based on this data, the website team implements changes. They streamline the checkout process, optimize the form for mobile devices, and add clear progress indicators. These changes, driven by data-driven insights from the analytical report, result in a significant decrease in bounce rates and a positive increase in customer conversions.
Pro Tip-From optimizing marketing campaigns to bolstering sales performance and improving user experience, these reports empower businesses to make informed decisions based on concrete data, ultimately leading to success.
Conclusion
Analytical reports have transformed from static documents into powerful tools that unlock the hidden potential within your business data. By harnessing the insights gleaned from these reports, you can make data-driven decisions that optimize marketing campaigns, boost sales performance, enhance user experience, and ultimately propel your business forward. Remember, the journey from data to insight starts with clearly defined goals. Once you know what you want to achieve, you can gather the necessary data and use the tools to analyze it effectively.
DiGGrowth, a cutting-edge analytics platform designed to optimize marketing strategies, can be your trusted partner in this journey. With its advanced features and actionable insights, DiGGrowth empowers you to make informed decisions and achieve remarkable results.
Contact us at info@diggrowth.com to learn more about how DiGGrowth can transform your business.
Sources
https://pressbooks.calstate.edu/writingargumentsinstem/chapter/analytical-reports/
https://www.coursera.org/in/articles/what-is-data-analysis-with-examples
https://matomo.org/blog/2024/01/web-analytics-reports/
Ready to get started?
Increase your marketing ROI by 30% with custom dashboards & reports that present a clear picture of marketing effectiveness
Start Free Trial
Experience Premium Marketing Analytics At Budget-Friendly Pricing.

Learn how you can accurately measure return on marketing investment.

How Predictive AI Will Transform Paid Media Strategy in 2026
Paid media isn’t a channel game anymore, it’s a chessboard. Search, social, programmatic, video, influencer, native,...
Read full post post
Don’t Let AI Break Your Brand: What Every CMO Should Know
AI isn’t just another marketing tool. It’s changing how we connect with customers, personalize content, and...
Read full post post
From Demos to Deployment: Why MCP Is the Foundation of Agentic AI
A quiet revolution is unfolding in AI. And it’s not happening inside research labs. For decades,...
Read full post postFAQ's
Analytical reports stand out by offering more than just data presentation. They delve deeper into the numbers to provide actionable insights and recommendations. These reports are crucial for businesses, enabling data-driven decision-making, optimizing operations, and driving growth.
Certainly, analytical reports are extensively used across industries. For instance, businesses utilize them to tailor marketing strategies, improve sales performance, and enhance user experiences on websites or apps. These reports help identify trends, uncover hidden patterns, and guide strategic decision-making.
Crafting an effective analytical report involves several key elements. These include an executive summary to provide a concise overview, a methodological framework to outline data collection and analysis methods, a clear data presentation, a thorough analysis, and actionable recommendations. Each component is vital in ensuring the report is informative and actionable.
Businesses can start by setting clear goals for what they aim to achieve with analytical reports. Next, they must gather relevant data from various sources, such as website analytics, CRM systems, or financial records. Utilizing tools like DiGGrowth and Excel, they can analyze this data to derive actionable insights that inform decision-making processes.
While analytical reports are centered around data analysis, their primary purpose is to offer actionable insights for decision-makers. These reports go beyond presenting raw data; they interpret it, identify trends, and provide recommendations based on the analysis. This allows decision-makers to make informed choices that drive business growth and success.